
How is DevOps going within your organization? If you need some help measuring just how well it is going, we have prepared a list of some key DevOps metrics to track. These metrics can help you understand how your team is doing over time.
The word DevOps means different things to different people. Some say it a culture and every vendor in the industry claims that their tools help with DevOps. Depending on how you define DevOps, some of these metrics may matter more or less to you and your team.
I define DevOps as everything that relates to deploying and monitoring your applications. In many ways, this bleeds over to site reliability engineering. At Stackify, we don’t even have an operations team to collaborate with. Our developers deploy directly to the cloud and we operate in more of a “NoOps” style. Check out my blog post to learn more about my views on what DevOps is.
Before you figure out what DevOps metrics to track, you need to identify what challenges your organization has and what problems you are trying to solve. At Stackify, our biggest issue has been not deploying often enough and lowering our defect escape rate. Our executive team is putting a big focus on those specific metrics for 2018.
DevOps is all about continuous delivery and shipping code as fast as possible. You want to move fast and not break things. By tracking these DevOps metrics, you can evaluate just how fast you can move before you start breaking things.
The main goals of DevOps are velocity, quality and application performance.
You want to ship code as fast and often as possible. How fast you can do this will vary wildly based on your type of product, team, and risk tolerance.
Even if you don’t track any DevOps metrics around your velocity, you should at least measure how you are doing on quality. Perhaps you try to ship when you can, and you don’t really care how fast exactly. However, you always care about quality. The last thing you want is to be chasing production fires all the time.
The third piece of the equation is performance. You could argue that it is also at odds with your goals of high velocity and quality. Performance is also related to quality, but perhaps a little different.
Tracking how many stories, feature requests, and bug fixes are being deployed is another good DevOps metric. Depending on how large your individual work items are, their counts could vary wildly. You could also track how many story points or days’ worth of development work are being deployed.
Tracking how often you do deployments is a good DevOps metric. Ultimately, the goal is to do more smaller deployments as often as possible. Reducing the size of deployments makes it easier to test and release.
I would suggest counting both production and non-production deployments separately. How often you deploy to QA or pre-production environments is also important. You need to deploy early and often in QA to ensure time for testing. Finding bugs in QA is important to keep your defect escape rate down.
This might seem like a weird one, but tracking how long it takes to do an actual deployment is another good metric. One of our applications at Stackify is deployed with Azure worker roles and it takes about an hour to deploy. It is a nightmare. Tracking such things could help identify potential problems. It is much easier to deploy more often when the task of actually doing it is quick.
If the goal is shipping code quickly, this is a really key DevOps metric. I would define lead time as the amount of time that occurs between starting on a work item until it is deployed. This helps you know that if you started on a new work item today, how long would it take on average until it gets to production. This is also a good metric to help with BizDevOps.
The best and worst indicator of application problems is customer support tickets and feedback. The last thing you want is for your users to find bugs or have problems with your software. Because of this, they also make a good indicator of application quality and performance problems.
To increase velocity, it is highly recommended that your team makes extensive usage of unit and functional testing. Since DevOps relies heavily on automation, tracking how well your automated tests work is a good DevOps metrics. It is good to know how often code changes are causing your tests to break.
Do you know how many software defects are being found in production versus QA? If you want to ship code fast, you need to have confidence that you can find software defects before they get to production. Your defect escape rate is a great DevOps metric to track how often those defects make it to production.
The last thing you ever want is for your application to be down. Depending on your type of application and how you deploy it, you may have a little downtime as part of scheduled maintenance. I would suggest tracking that and all unplanned outages.
Most companies have some service level agreement (SLA) that they operate with. It is also important that you track your compliance with your SLAs. Even if there are no formal SLA, there probably are application requirements or expectations to be achieved.
We all hope this never happens, but how often do your deployments cause an outage or major issues for your users? Reversing a failed deployment is something we never want to do, but it is something you should always plan for. If you have issues with failed deployments, be sure to track this metric over time. This could also be seen as tracking mean time to failure (MTTF).
Tracking error rates within your application is super important. Not only are they an indicator of quality problems, but also ongoing performance and uptime related issues. Good exception handling best practices are critical for good software.
Errors are a fact of life for most applications. At Stackify, we process millions of messages an hour across a couple hundred servers and over a thousand SQL databases. A few errors here and there are just part of the noise of a busy system. It is important that you keep a pulse on your error rates and look for spikes.
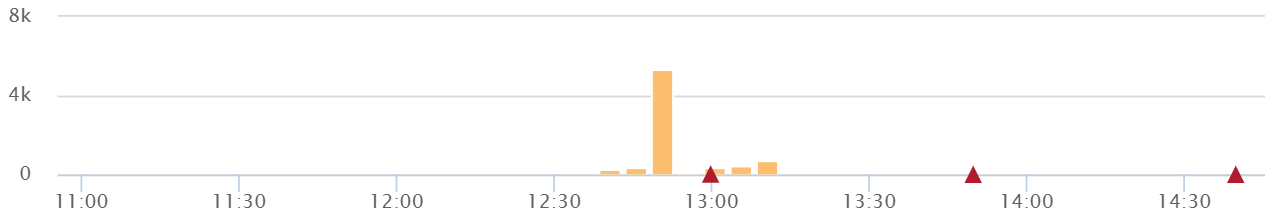
After a deployment, you want to see if the amount of transactions or users accessing your system looks normal. If you suddenly have no traffic or a giant spike in traffic, something could be wrong.
The last thing you ever want to see is no traffic at all. You could also see a spike in traffic if you are using microservices and one of your applications is causing a lot more traffic all of a sudden.
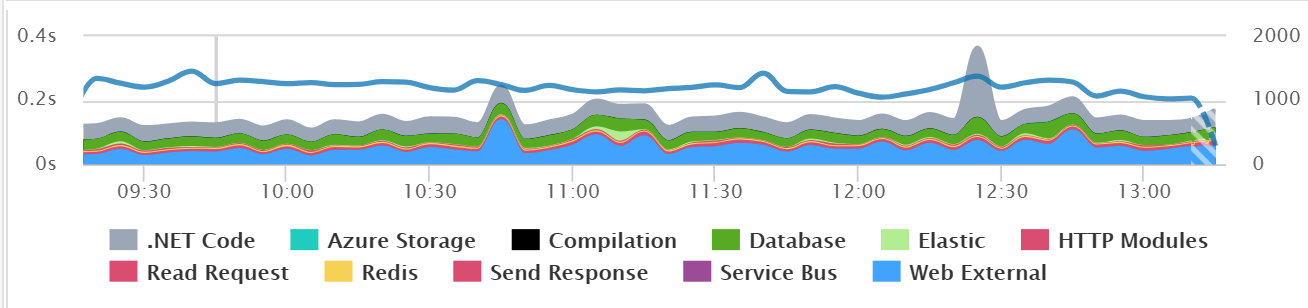
Before you even do a deployment, you should use a tool like Retrace to look for performance problems, hidden errors, and other issues. During and after the deployment, you should also look for any changes in overall application performance.
It might be common after a deployment to see major changes in the usage of specific SQL queries, web service calls, and other application dependencies. Tools like Retrace can provide valuable visualizations like this one below that helps make it easy to spot problems.
When problems do happen, it is important that you identify them quickly. The last thing you want is to have a major partial or broad system outage and not know about it. Having robust application monitoring and good coverage in place will help you detect issues quickly. Once you detect them, you also have to fix them quickly!
This metric helps you track how long it takes to recover from failures. A key metric for the business is keeping failures to a minimum and being able to recover from them quickly. It is typically measured in hours and may refer to business hours, not clock hours.
Having good application monitoring tools in place to quickly identify issues and quickly deploy the fix is important to reducing your MTTR.
Beyond the DevOps metrics listed above, there are dozens of other metrics you can track that are specific to your applications. Most of them are not necessarily relevant to DevOps in regards to deploying your application. However, they are very critical for monitoring the usage and performance of your applications in production.
For example, at Stackify, we use custom metrics to track how many log messages are received via our API per minute. This is a critical metric that helps us understand the volume of data flowing through our system. Depending on your application, you may have similar custom metrics that are critical to your application.
Read more:
After a deployment, you will want to keep an eye on all of your critical application metrics to ensure that everything still looks normal.
If you want to take DevOps to the next level, I’m sure that our list of DevOps metrics will help give you some ideas of what to track and improve. The goal of DevOps is collaboration and getting developers more involved in the deployment process and application monitoring. If you need some help with monitoring your applications, then be sure to check out our product Retrace.
Related articles:
Stackify's APM tools are used by thousands of .NET, Java, PHP, Node.js, Python, & Ruby developers all over the world.
Explore Retrace's product features to learn more.
If you would like to be a guest contributor to the Stackify blog please reach out to [email protected]


