We are very excited to release APM+ v2.2 today!
We first released APM+ for ASP.NET in April and have been working tirelessly to make it the best APM product on the market for ASP.NET application performance management. We think today is that day!
First off, special thanks to everyone has used the product to date and all of your wonderful feedback. A lot of the changes being released today are based directly on your requests. Special thanks to Carbonite, Geeks with Blogs, and the many other companies all around the world for your feedback.
Numerous improvements have been made to lower CPU and memory utilization. In some isolated scenarios we found high CPU usage and a memory leak in the existing version. These have been fixed.
Nancy and ServiceStack are popular open source alternatives to the standard MVC and Web API frameworks. We are excited to say we automatically support them like first class citizens now and they require zero configuration or code changes to show up in Stackify.
Due to your requests we have added support for several other frameworks that are now automatically profiled out of the box. Including Oracle, MySQL, PostgreSQL, MSMQ, NServiceBus, Azure Service Bus, Azure storage, redis, Memcached, AppFabric, and several others with even more coming.
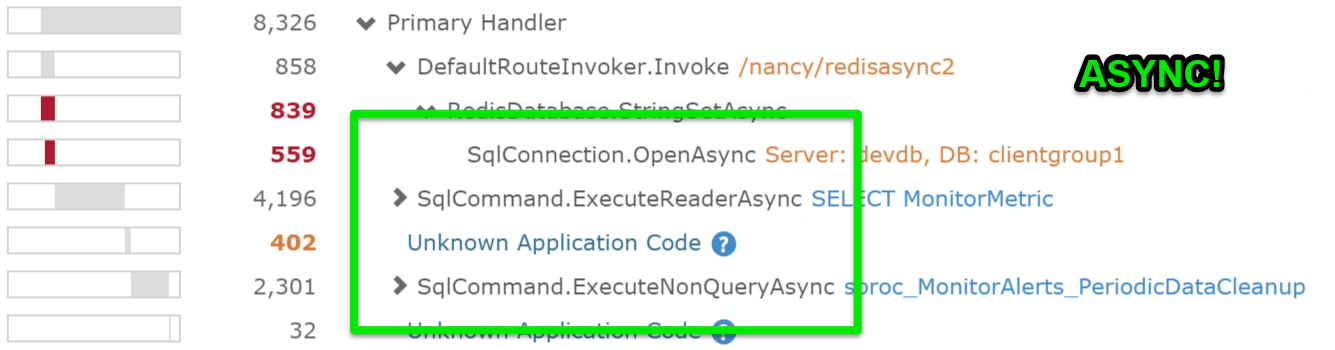
As far as we know, Stackify’s APM for ASP.NET is the only application performance management tool that supports async/await in modern apps with zero code or configuration changes. This is a pretty big deal since almost all new .NET development is done in async/await patterns. In the previous version, we had support for async controller methods, SQL Server, and web request calls. Today, we are excited to say that we have support for many more frameworks, including the ones listed above. Good examples are StackExchange Redis, Azure Service Bus & Storage, etc. Not all libraries support async.
In the last APM version, we enabled collecting all .NET exceptions that are thrown via code profiling (not to be confused with using something like log4net). Unfortunately that also created a lot of noise for some clients so we did a hotfix to disable them. For this release, exceptions collected via APM will only show up in profile traces and not in our errors & logs module anywhere. (Those reported by log4net, etc will still show) We will be releasing new settings soon to let you control this behavior: Hide all, show all, or show only uncaught exceptions.
On a side note, Geeks with Blogs found the cause of a huge performance problem because of all the exceptions APM+ found that they didn’t know about. Read about that case study here: Finding Hidden Exceptions and Application Performance Problems with APM+
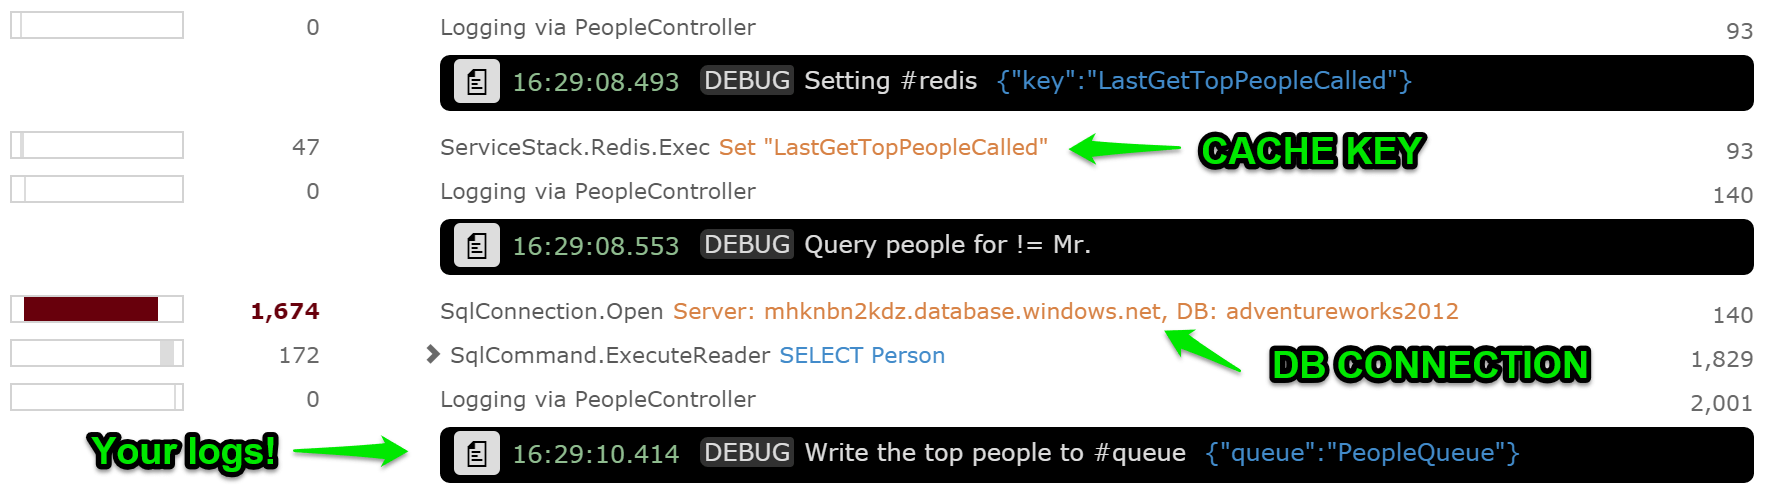
We have made several small improvements to the APM+ UI within the application dashboards. A lot of the new frameworks will now show up in your profile traces and expose important fields that are relevant. For example, when working with cache, you can automatically see what the cache key was. Database queries show the server and database name. Working with queues shows the queue name, etc. This is all part of the intelligence and + in APM+.
We will automatically push out an update to the Stackify agent that runs as a Windows service on your servers. The new CLR profiler that collects data from APM will not take affect until your IIS application pool recycles. You can do a simple recycle manually to force it, or it will take effect the next time IIS restarts the app pool on its own.
We have many more things in the pipeline. Including support for Azure Web Apps, easier ways to set up custom profiling configuration, custom dashboards, support for additional frameworks, and much more.
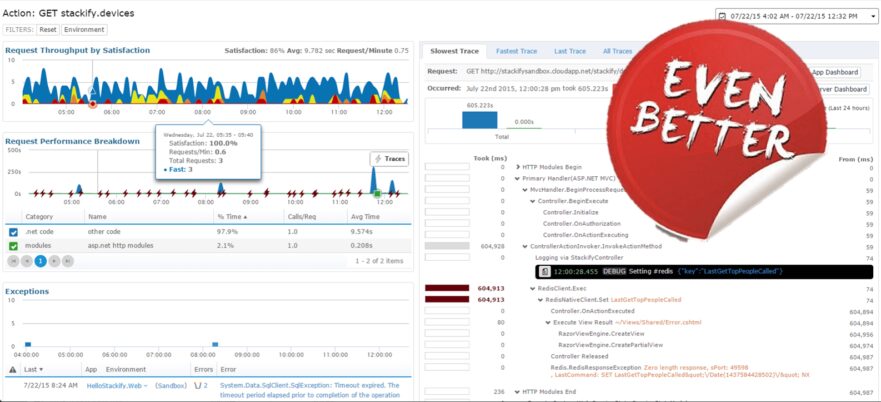
Did you know that Stackify APM+ supports monitoring a specific URL (AKA key transaction) or SQL query? For a specific web request, you can monitor satisfaction score, error rate, requests per minute, or average load times. For SQL queries, you can monitor average execution time and volumes. Read more about that here
Stackify's APM tools are used by thousands of .NET, Java, PHP, Node.js, Python, & Ruby developers all over the world.
Explore Retrace's product features to learn more.
If you would like to be a guest contributor to the Stackify blog please reach out to [email protected]