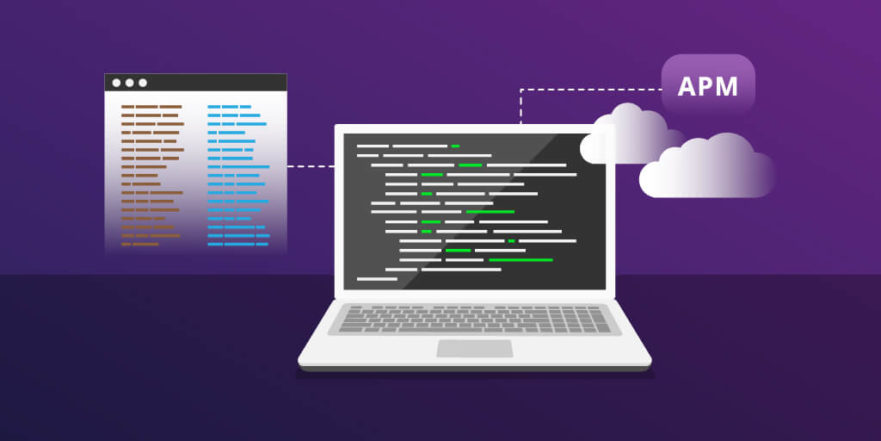
More information is always a good thing—especially when it comes to application performance monitoring (APM).
One way to gather more information for APM purposes is to leverage application information in addition to environment data. In-context information generated and logged by the application itself can be invaluable when trying to diagnose and resolve anomalies during an application’s lifecycle.
This article explains why application logging data should be a key part of your APM strategy.
There are two main types of logs: Infrastructure logs and application logs.
Infrastructure logging is the most common type of logging used by DevOps and system administrators to find and triage errors. It’s the first place DevOps teams usually look for sources of APM data.
Typically, these logs are set to the equivalent of ERROR level with the ability to go to DEBUG by using special flags at runtime. Performance and capacity can often be impacted when going past the default logging levels.
Examples of infrastructure logs include logs from firewalls, syslog, servers, and load balancers like NGINX, Microsoft event logger, and databases such as SQL Server, MySQL and MongoDB.
Custom logs are produced from within an application and are added to an application during the build part of the application lifecycle by developers as language-specific frameworks need to be used.
Developers define what goes into each log message, and at what level it will be processed. Since the messages are defined by the developer and run inline and in context with the individual requests the application is processing, the log messages can include any type of environment or session-specific data the developer wants to include.
Stackify’s Retrace solution supports custom application logs from common application logging frameworks. Including log4net, NLog, log4j, logback, and many others.
So, how can you use custom logs to help drive your APM strategy? You should start by configuring the appropriate application logging levels. The logging level can often only be adjusted on application startup, but some frameworks allow for dynamic changes.
Below are the common log levels used in the industry, listed in order of the amount of information they produce.
In practice, most applications in production and performance tests run by default at ERROR, with FATAL being the next most common. QA environments often run at ERROR or INFO, with DEBUG being selectively used to target specific sub-components when working to resolve defects. In their local development environment, developers often run at DEBUG so all their messages are being produced.
The most important thing you can do to help someone stay focused, especially during a production incident, is to keep them in context. That is why the “single pane of glass” for support teams has been the holy grail that vendors have been selling for a long time.
The difference with APM tools is that Ops teams can finally see applications from the point of view of the customer and developers. Having this view, combined with in-context logging, drastically reduces the time it takes to diagnose and resolve any issue.
The best APM tools can import logs, and as you drill down into the application to find the source of the problem, the APM tool also can narrow down which logs are being included in the data, starting with all nodes and all applications to only specific applications, and the nodes they are running on down to individual log files with specific time frames as the context becomes more targeted.
Without this integration, support teams have to constantly leave the context of the APM tool to connect to an individual server and read that log for the time frame instead of the tools extracting it for them.
Combining infrastructure and application logs for the components where the rest of the APM suite has identified a bottleneck will help diagnose errors or potential faults, which will aid in proactively maintaining the application runtime and the ability to notify the development teams of potential application defects before they start causing fatal errors.
Stackify’s Retrace solution provides full APM capabilities with tightly integrated log management and error tracking. Retrace makes it easy for developers to troubleshoot application problems.
Stackify's APM tools are used by thousands of .NET, Java, PHP, Node.js, Python, & Ruby developers all over the world.
Explore Retrace's product features to learn more.
If you would like to be a guest contributor to the Stackify blog please reach out to [email protected]