Of all the modern development practices which I use day to day, none other has been more beneficial to me than the introduction of quick feedback loops in my workflow. Although a concept made popular by the Agile methodology and practices, it’s something most of us deal with when we invoke the compiler (or linter) which tells us if our program is a valid one.
When informed about a problem whilst in the moment I’m in a much better position to make corrections or come up with alternative solutions. Without a quick feedback loop, like an ASP.NET profiler, the passing of time makes it difficult to get into the initial mindset which caused the problem to begin with.
Note: This a republished independent review by Vince Panuccio. You can read his original review on his blog. This is not a sponsored post and am not being paid by Stackify.
Up until now ASP.NET profiling and performance tuning has always been a process I’d invoke toward the tail end of a project and it’s either addressing a known issue or a stress testing scenario where I probe for problems in our beautifully constructed code to see if our assumptions about performance are correct. As you can imagine there’s a problem with this approach.
I came across a product from Stackify called Prefix a few months ago when it was in beta and I’ve been using it as a profiling tool as I develop ever since. What makes it unique is that it allows you to get continuous feedback on the performance characteristics of your server side code, SQL and method execution timings. For those of us using Entity Framework (and other ORMs), it allows you to see the SQL being generated by the provider. But there’s much more than that, the most impressive feature for me was visualizing the entire request pipeline when building web applications.
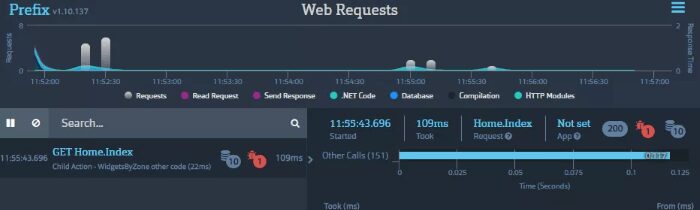
Once downloaded and installed, Prefix attaches itself to IIS or IIS Express and displays information about each web request. By having this screen open I can immediately see information about
From here you can drill down into the request a little more and view things such as
Quite a handy, holistic view of the request. The exception information (especially caught exceptions) was something I wasn’t expecting but makes sense. Exceptions, relatively speaking, do have a small performance penalty when unwinding the stack. Although minor, having a large number of caught exceptions which would otherwise go unnoticed, show up in Prefix, is invaluable.
To capture this data I didn’t have to install any NuGet packages into my solution (as required by Glimpse) or configure anything, I didn’t have to attach the SQL Profiler to obtain the SQL queries or launch Chrome developer tools. Granted these tools offer far more granular information, but what I have here is a great platform to work with as I write code for that instant feedback without all the ceremony.
Taking a closer look at the ASP.NET profiler data provided by Prefix I can see a few more interesting things. For starters you can see how long it took to download the headers (in this case 0 due to running locally) as well as the amount of time taken for MVC to deserialize the request, how long a query within a transaction and the COMMIT itself took to execute, and my favorite, seen in the last screenshot is the amount of time taken to execute a SQL statement and the time it took to download the results. Awesome.
Time taken to download HTTP headers
Time to deserialize the request / execute SQL within a transaction
SQL timings
As I dug into Prefix a little more I discovered that calls to external web services are measured and logging statements are printed in-line. Just to demonstrate, I’ve added a WebClient call to download the Google homepage and a Trace and Debug statements to my HomeController.
|
1
2
3
4
|
Trace.WriteLine(“Downloading via WebClient”);
var webClient = new WebClient();
webClient.DownloadString(“https://www.google.com”);
Debug.WriteLine(“Completed download”);
|
The web service call which is conveniently indicated next to the number of database calls also shows the trace and debug statements as well as some information relating to the external call. There’s also support for HttpClient and HttpWebRequest/HttpWebResponse as well as WCF and WebAPI.
Out of the box, support is quite extensive but can be further extended by adding NuGet packages to support logging frameworks such as log4net, NLog, and Elmah.
|
1
|
<add key=“Stackify.AppName” value=“NopCommerce” />
|
I find myself swimming in tools more and more as time goes on. Part of it is my love for getting more information and more data to make informed decisions, another part is trying new and shiny things and also to determine the value they can provide. Prefix, an ASP.NET profiler, is one tool I seem to have open all the time and is now an essential part of my proverbial toolbelt that I rely on. I recommend you give it a try.
Prefix, the amazing ASP.NET profiler by Stackify, is free! Download it today! And it’s now available even for other languages like Java, Python, Ruby, Node.js, and PHP.
Stackify's APM tools are used by thousands of .NET, Java, PHP, Node.js, Python, & Ruby developers all over the world.
Explore Retrace's product features to learn more.
If you would like to be a guest contributor to the Stackify blog please reach out to [email protected]


