
I’ve written in the past about how Stackify was “born in Azure” and we’ve never used any other hosting solution. In this post, I want to share how we make sense of our Azure EA (Enterprise Agreement) bill and usage. Azure billing can be quite a mess to figure out. Here are our top tips to analyze your usage and avoid extra costs.
When you get started, you’re working in small doses, spending a few hundred dollars per month on one or two resources…Fast forward 5 years, and you’re spending tens of thousands of dollars across many resources.
We are always looking for ways to cut costs, and the increased volume of usage and complexity makes it difficult to know exactly where you are spending money. We take advantage of having an Enterprise Agreement in place, but the reporting we get out the other side has two levels of granularity: Sum Total or Thousands of Lines of Detail.
Recently, we started using a great free tool: azure-costs.com. It connects to your account, pulls in your usage, and pulls in your EA price sheet, and shows you how much you are spending. You can break it down by region, subscription, service type, etc. It’s pretty great…Until you hit the scenario we just did.
Our Enterprise Agreement is up for renewal and we’d like to negotiate additional price breaks on our heavily used services. “Easy,” I say and pull up Azure-Costs and sort by the most expensive component.
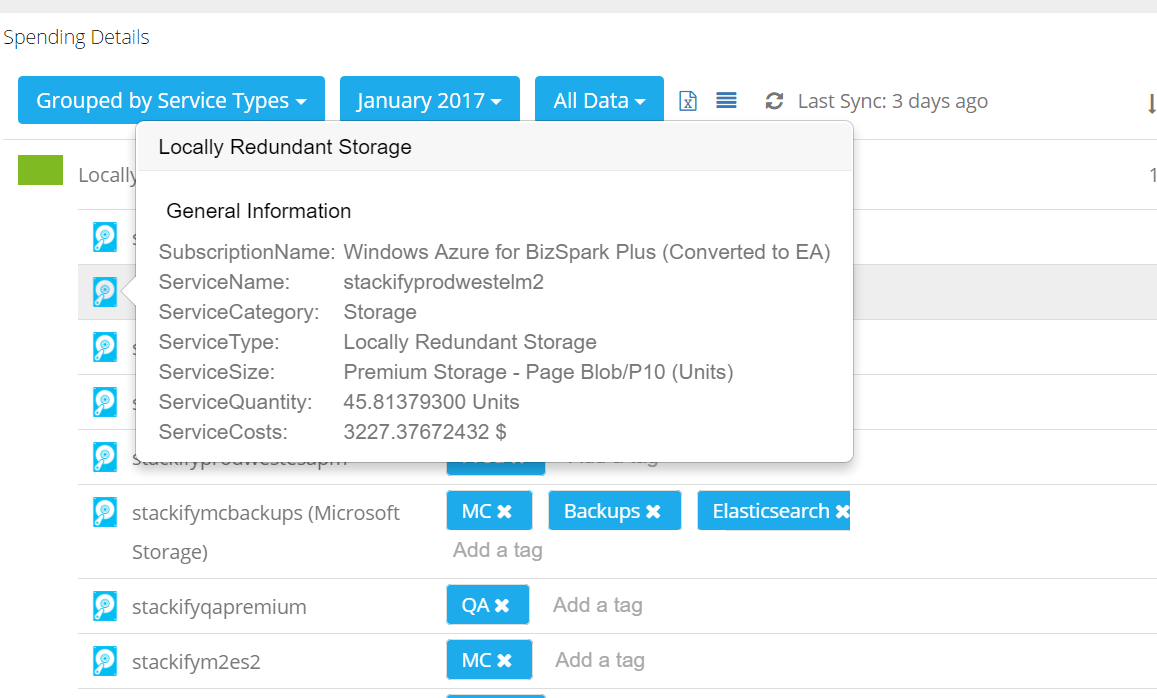
There it is: Locally Redundant Storage is my most expensive service, and I have a number of resources using it. So, I email my sales rep and say “Give me the biggest discount you can on locally redundant storage!” But it’s not so easy.
In order to do this, we need to be able to identify the specific product part numbers that we want to negotiate. And the price sheet has 8619 unique part numbers on it. Azure-Costs doesn’t show me the part number. (For that matter, it doesn’t even show region, which would make it somewhat easier to find.)
But surely it has to be easy to find your SKU, right? Not so fast. Let’s look for locally redundant storage on the price sheet. That’s 291 SKUs. For one service type.
Same thing applies with one of our next largest categories: Azure Cloud Services. That’s 1810 individual SKUs. Clearly, I need a better way to analyze our usage.
Remember earlier, I mentioned that the EA billing portal gives two levels of detail. It’s time to look at the big hairy data set, which fortunately is available in CSV. Pulling only 3 months of data yields over 150,000 rows, and fortunately, only 145 distinct “MeterIDs” in the data set.
A little quick aggregating and sorting and we should be done, right? Well, once again, not so fast. The MeterID is a GUID value type. The price sheet has part numbers such as: “N9H-00074.”
So, how do you correlate your actual usage to the part numbers you have pricing for? According to this twitter conversation I had with Azure Support, I should be using a preview API to dig out the data.
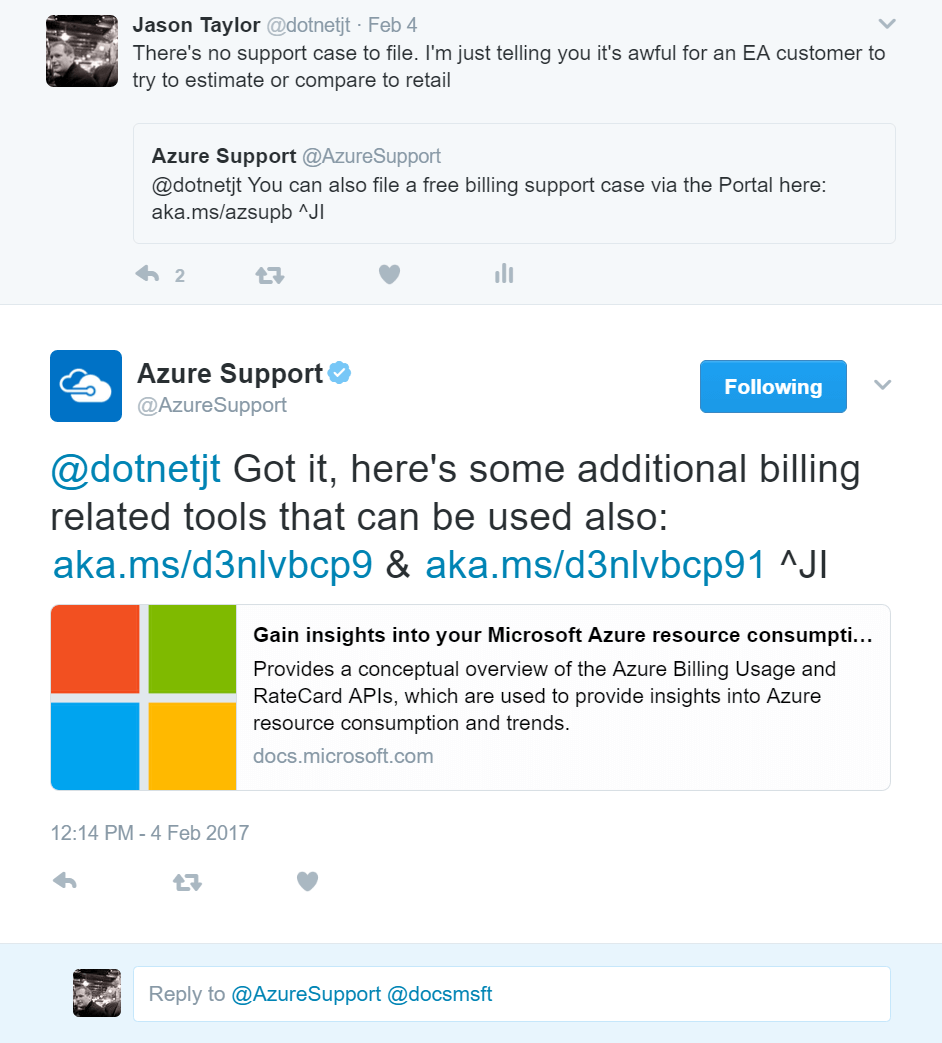
Yes, that’s right. They want me to write code… to figure out my bill.
Show of hands: who has an accounting department that knows how to use an API?
No one? Thought so.
I’m not having it, and neither should you because there is an easier way.
You just need
Import into SQL, SQL Express, or heck…even Microsoft Access. It’s just two tables. I pull them into two tables called ‘DetailedUsage’ and ‘PriceList.’
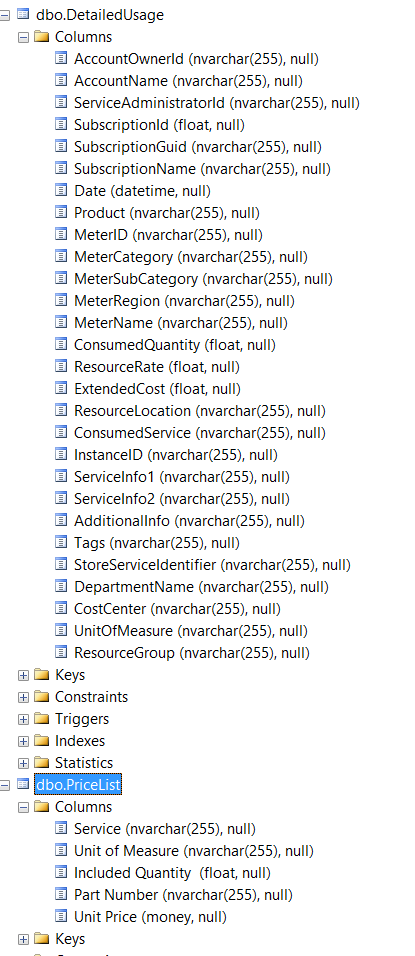
(Pro Tip: Remember to remove spaces from the column names. I missed a couple.)
If you’re used to writing SQL, you’re not going to like this part because it’s ugly. But you want to join Product to Service on a varchar field.
Want to know your spend per part number?
SELECT
  pl.[part number],
  du.product,
  SUM(du.extendedcost) AS 'Cost'
FROM detailedusage du
LEFT JOIN pricelist pl
  ON du.product = pl.[service]
GROUP BY pl.[part number],
         du.product
ORDER BY SUM(du.extendedcost) DESC
Want to know your spend per resource, with part number?
SELECT
  pl.[part number],
  du.product,
  du.instanceid,
  SUM(du.extendedcost) AS 'Cost'
FROM detailedusage du
LEFT JOIN pricelist pl
  ON du.product = pl.[service]
GROUP BY pl.[part number],
         du.product,
         du.instanceid
ORDER BY SUM(du.extendedcost) DESC
Need more detail?
SELECT
  du.product,
  pl.[service],
  du.metercategory,
  du.metersubcategory,
  du.metername,
  du.meterregion,
  du.meterid,
  pl.[part number],
  pl.[unit price],
  pl.[unit of measure],
  du.resourcerate,
  SUM(du.extendedcost) AS 'Cost'
FROM detailedusage du
LEFT JOIN pricelist pl
  ON du.product = pl.[service]
--where metersubcategory='Locally Redundant' and metercategory = 'Storage'
GROUP BY du.product,
         pl.[service],
         du.metercategory,
         du.metersubcategory,
         du.metername,
         du.meterregion,
         du.meterid,
         pl.[part number],
         pl.[unit price],
         pl.[unit of measure],
         du.resourcerate
ORDER BY SUM(du.extendedcost) DESC
You can learn some interesting things as well. In my original example, I was trying to find my spend on locally redundant storage. Azure-costs showed it was my most expensive category, and inside of there, my most expensive resource was named ‘stackifymc2es.’ I want to see more detail on it:
SELECT
  pl.[part number],
  du.product,
  du.instanceid,
  SUM(du.extendedcost) AS 'Cost'
FROM detailedusage du
LEFT JOIN pricelist pl
  ON du.product = pl.[service]
WHERE instanceid = 'stackifymc2es'
GROUP BY pl.[part number],
         du.product,
         du.instanceid
ORDER BY SUM(du.extendedcost) DESC
And here are all of the part numbers that specific resource has used:
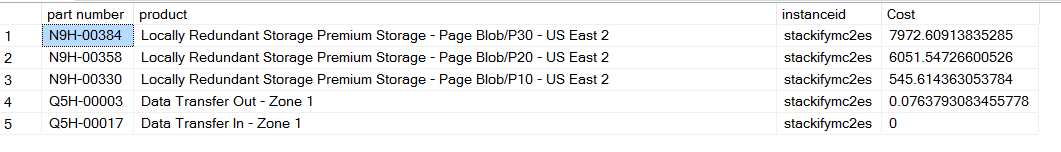
The reason I find this interesting is that this particular resource has used a few different levels of Premium Storage, as we tried to find the optimal configuration. So, on the surface, azure-costs.com showed that Page Blob/P20 in this instance was my biggest spend – but what if I had just recently upgraded it to use Page Blob / P30? For forecasting purposes, it’s good to see this bigger picture.
My Summary on How to Get a Summary of Your Azure EA Billing
There are a few different ways to accomplish this sort of analysis, but they either
This author’s opinion is that you shouldn’t have to work too hard or pay to analyze your usage. Once you’ve pulled this data into two very simple tables, querying the data out is easy. You can even dump the query results into Excel and give your boss a pretty graph. 🙂
Also check out our other recent blog post about saving money on Azure: https://stackify.com/lower-azure-pricing-optimize-costs/.
Note: One gap that I still find is in trying to compare your rates to retail resource rates. I’ll update this if and when I find a way.
Stackify's APM tools are used by thousands of .NET, Java, PHP, Node.js, Python, & Ruby developers all over the world.
Explore Retrace's product features to learn more.
If you would like to be a guest contributor to the Stackify blog please reach out to [email protected]