
Serverless computing is here, and I expect it to become really popular with developers over the next few years. At Stackify we are starting to take advantage of Azure Functions. As developers and a developer tool company, we know that it is still critical to monitor the performance of our application, even if it is deployed through a function-as-a-service platform like Azure Functions.
The good news is that Retrace supports Azure Functions running App Service plan mode. This means that you can leverage the full power of Retrace’s application monitoring. In this article, we are going to eat our own dog food and show you what Retrace can do for Azure Functions performance monitoring.
To learn how to install Retrace for Azure Functions, check out this article.
Retrace runs as a WebJob within your Azure Function. As your App Service Plan auto-scales from 2 to servers 10, Retrace will scale with it and monitor all of your application instances. Under the covers, your serverless application is still running on a server.
Retrace automatically instruments and profiles the underlying Azure Functions framework. It can track every time your functions are triggered. We have tested it with multiple types of functions. Including timer, Service Bus, HTTP triggers and others.
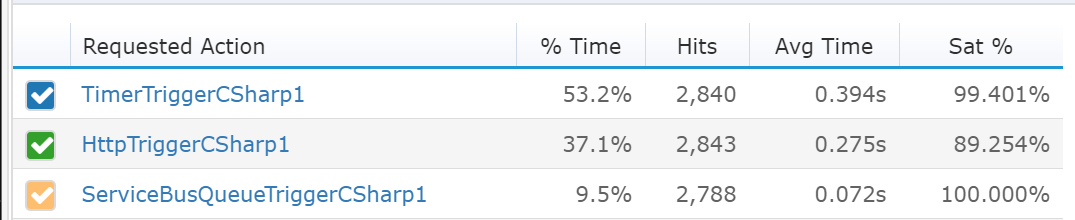
You can set any of your function actions to be a “key transaction” within Retrace to monitor the performance of that specific action.
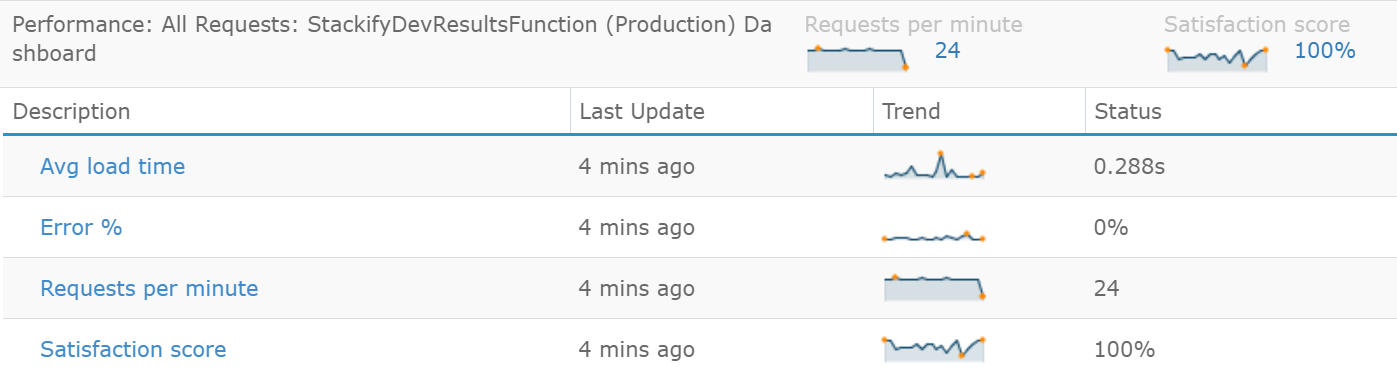
You can also monitor the performance of all of the functions within your Azure Function App. You can configure alerts around any of these metrics.
The real power of Retrace comes from the lightweight code profiling that we do. We can provide the same level of details for Azure Functions that we do for any other type of .NET application. If you wanted advanced Azure Functions performance monitoring, you have to leverage an APM solution like Retrace.
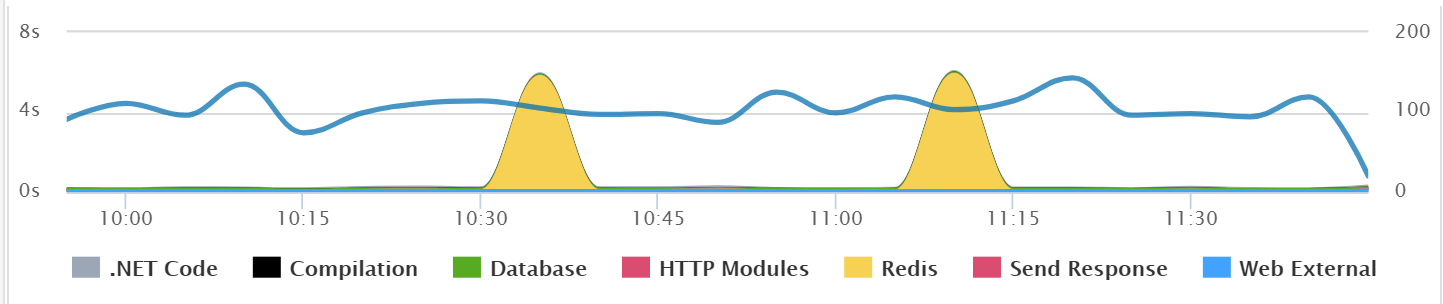
Since we track the performance of most common application dependencies, including SQL Server, Redis, external HTTP services and much more, it is easy to spot performance problems related to one of your application dependencies. In this example below, you can see big spikes caused by Redis.
Track and monitor the performance of every SQL query executed by your code. You can even setup alerting to monitor the performance of an individual SQL query.
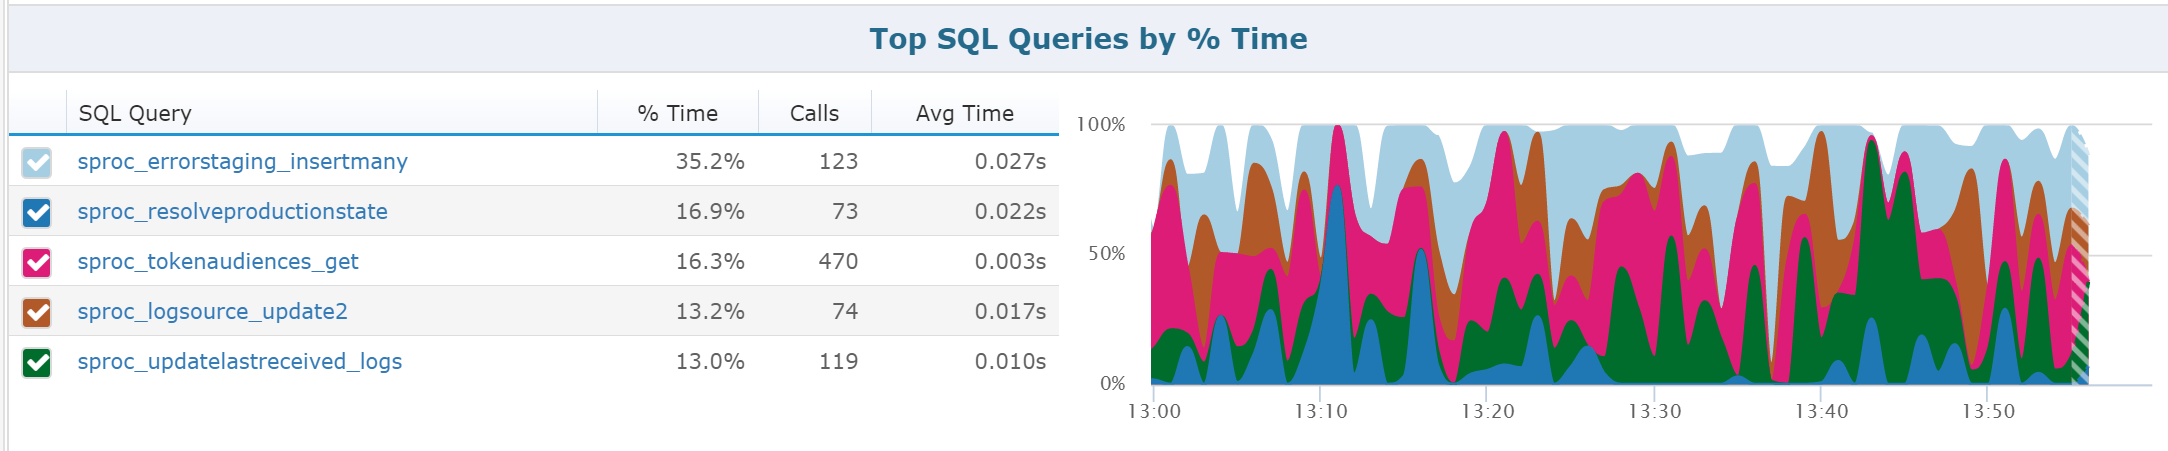
Sometimes application problems aren’t performance related. We did a release today and noticed that our code was making an unusually high number of SQL queries. By being able to see that, we were able to track down the problem quickly. We had a problem with our cache configuration which caused caching not to work.
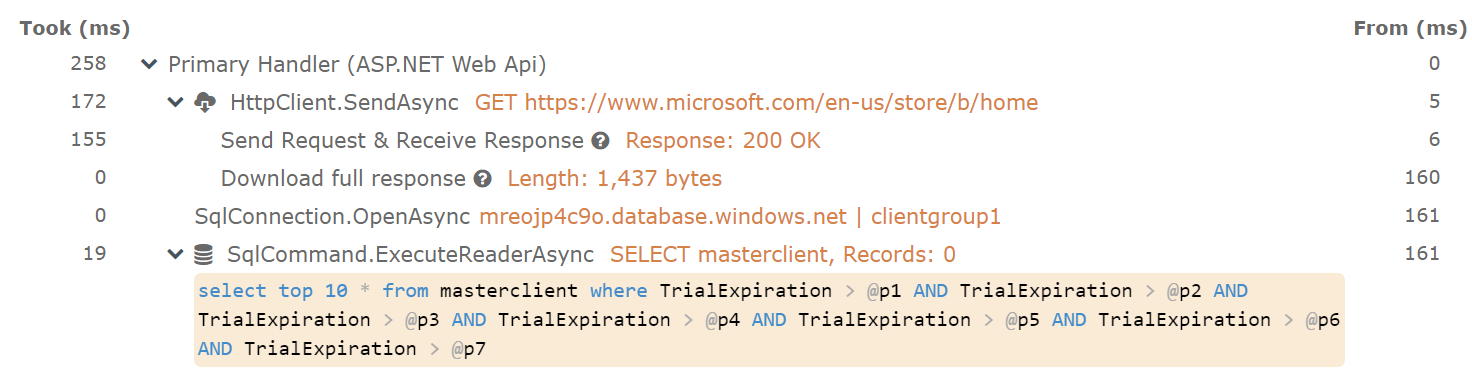
One of the most popular features of Retrace is the code level request tracing. If you have used our free tool, Prefix, you are probably familiar with it. If you have tried Prefix yet, you definitely should!
Here is a really simple example of request trace:
Since Retrace uses lightweight profiling to collect data about the performance of your application, it can also collect exceptions that are thrown in your code. Retrace will automatically collect these and has robust error reporting around what exceptions are occurring. You can configure it only to track unhandled exceptions or all, including ones that are caught in your code and thrown away.
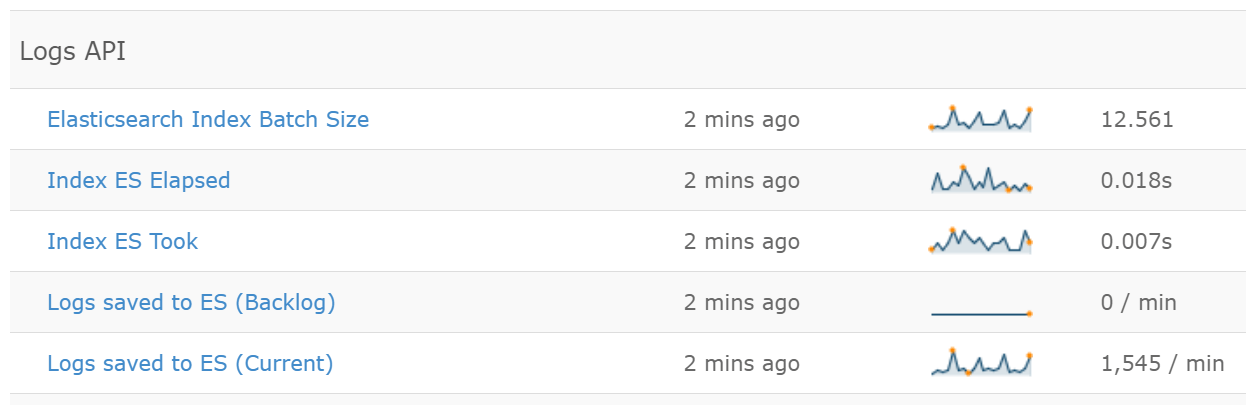
To better track the behavior and performance of our applications, we implement a lot of custom metrics. Retrace supports these by adding a couple of lines of code via our StackifyLib nuget package.
For example, we want to track how large our average batch size is we are sending to Elasticsearch. We also track metrics around how long it takes to send data to Elasticsearch.
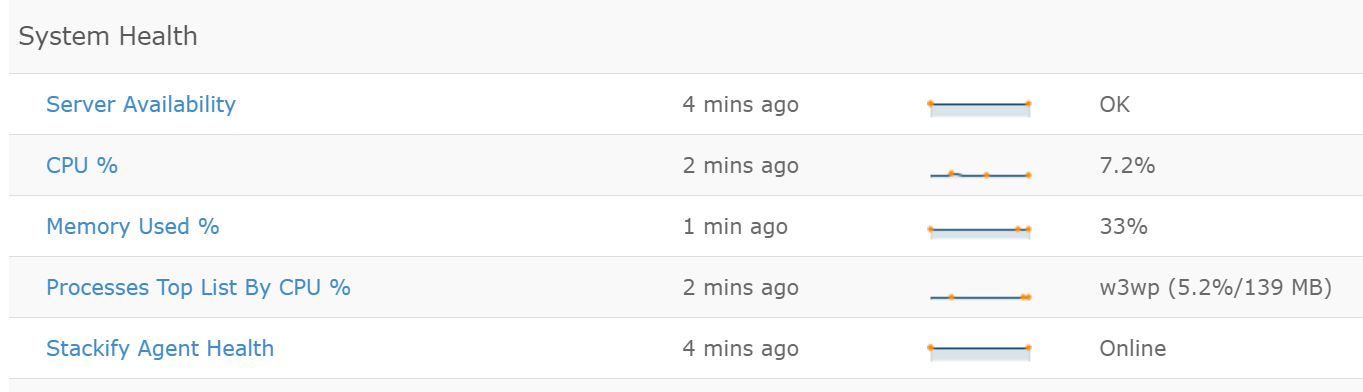
The CPU and memory usage of your Azure Function is automatically tracked. You can configure monitoring alerts on them.
Server and application monitoring has greatly evolved. Today, our apps don’t even run on servers, but we still need to monitor them. Solutions like Retrace make it easy for developers to monitor their applications, no matter where they are installed. Retrace supports standard virtual machines as well as Azure specific deployments like Azure Functions, Cloud Services, and App Services.
Retrace provides robust Azure Functions monitoring capabilities. You can closely monitor the performance of your application while also tracking error rates, behavior, usage, and much more.
Retrace is a very affordable APM solution. A free trial is available.
Stackify's APM tools are used by thousands of .NET, Java, PHP, Node.js, Python, & Ruby developers all over the world.
Explore Retrace's product features to learn more.
If you would like to be a guest contributor to the Stackify blog please reach out to [email protected]


