
The best-laid plans of mice and men still go off the rails sometimes. Even when you’ve been rigorous and put unit tests in place, there are times when you’ll want to jump in and debug an application or a unit test. In this article, we’ll take a look at 10 tips for .NET debugging.
A breakpoint is one of the fundamental units of debugging. It is a hint to the debugging environment that it should stop the execution of the application at a certain point. If you’re using the full Visual Studio IDE, then adding a breakpoint is simple. Click in the gutter next to the line of code on which you want to halt execution.
Breakpoints can be added to almost any line of code that is executed. This means that you can’t breakpoint on the [Fact] attribute in this code or on the actual function name. In the former case, you can drop into the definition of the attribute, if you need to break on it. In the latter, breakpointing on the first line of the function will stop execution before the function has been executed. Breakpoints can be added before you execute the code or while you’re debugging.
Sometimes a piece of code may be executed a bunch of times before you encounter the conditions you’re looking for. For instance, you might be working with a collection and the 93rd element is the one you need to debug. You could sit and hit F5 92 times to get to the record in which you’re interested, or you could use a conditional breakpoint. Conditional breakpoints will only cause the process to halt when a condition is met. The conditions can be very simple like counting the number of times a line has been hit. They can also be more complex like checking if some value is true.
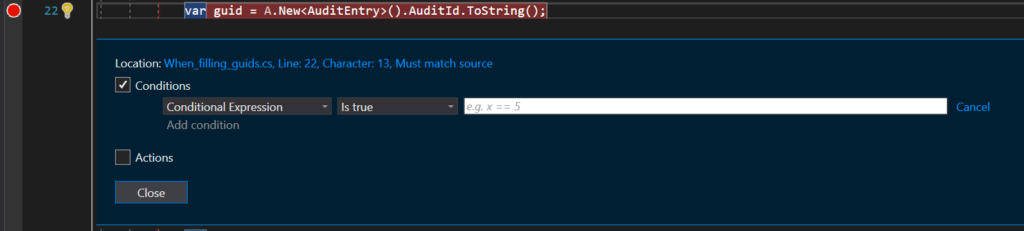
One underused feature in the conditions dialog is setting a breakpoint when a value changes. This can be really useful if you’re trying to track down what is changing the value of some variable. Additionally there is a checkbox for performing an action when the breakpoint is hit. You can quickly add temporary logging to a running application in this way.
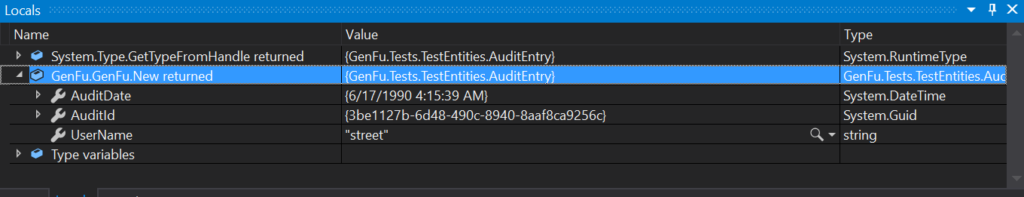
In most cases, you can use the mouse to hover over a variable when debugging to get an idea of what value is held in the variable. One place where you can’t do this is for getting the return value from a function. You can’t simply hover over the return statement and get a preview of what is going to be returned from the function. To pull a value, you can look in two places: the watches and locals.
In the locals window, you can see the return value by looking for the name of the function (fully qualified, of course) followed by the word “returned”. I put a breakpoint on the closing brace from the function to see the value which would be returned.
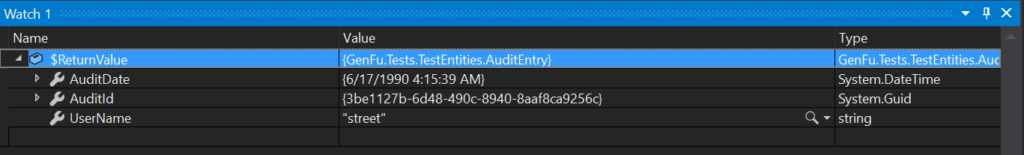
In the watch window, you can refer to the current return value by examining a special variable called $ReturnValue
Being able to see a value in the watch panel is one thing, but unlike my kids in any store that sells china, you’re allowed to poke at things. If you need to simulate some return value or check what would happen with a specific, difficult-to-reproduce set of variables, then it can be done by poking into the values shown in the locals window. This technique is particularly useful if you have a boundary condition you need to test out, but aren’t sure how to set up the inputs to get the outputs you need. In the video below, you can see a preview of the sum of first and last as provided by our next debugging tip: OzCode.
Visual Studio is the Cadillac of IDEs when it comes to debugging, as compared with most any other IDE. Adding OzCode straps a set of rocket boosters to it. It provides a rich set of tools that make debugging even easier. I’m particularly fond of the changes it makes to the display of code during a debugging session. You can see, in the video above, the values of variables are shown inline without having to hover over them. In addition, you can search within a complex object or collections of objects for specific values.
The tool is not free, but it is a worthwhile addition to your toolbelt. If you’re working in a code base that is not easily tested with unit tests, the purchase is doubly worthwhile.
Sometimes the best form of debugging is not debugging. The thing with debugging is that it tends to be quite a slow process. You need to set up a test case, set some breakpoints, and run through the application to get to where you need to be to exercise the behavior you wish to debug. I’ve found this to be a very frustrating experience in the past. Graphical applications frequently require spending a bunch of time clicking on buttons to get to the location with the problem.
Instead of struggling with this, it is likely better that you set up a unit test to exercise the function in question with exactly the values you need. The techniques presented thus far in this article may be useful in getting you to a state where you know which values are causing a problem. These can then be extracted into a unit test to tighten up the debugging cycle. You can, of course, debug into the unit tests to really zero in on the problem.
There are countless great unit testing tools, some of which can even generate some tests for you. Leveraging these tools and building a suite of unit tests may reduce the number of times that you have to drop to debugging in the future. The end result is that you’ll feel more comfortable about changing code in the future, knowing you have a safety net of tests to fall back on.
You might think of Prefix as just a tool for getting some insight into what your code is doing, but it’s more than that. You can use Prefix to find everything from n+1 errors to hidden exceptions and getting code suggestions. Frequently looking at the logs as surfaced by Prefix will be enough to point you in the right direction to fix your bug. Prefix can just run all the time even when you’re doing the initial development so you can catch bugs while they’re still on your computer and you don’t have to debug problems in production.
Read Why APM Usage is Shifting Left to Development and QA.
If your codebase is difficult to test, and there are some of those out there, then you might want to pick up a copy of Michael C. Feathers’ book “Working Effectively with Legacy Code”. The appendix in this book offers concrete advice about how to extract testable code from a jumble of untestable code.
I am a LINQ addict. There, I’ve come out and said it. There is no application I build that doesn’t make heavy use of LINQ. I like the functional nature of being able to sort, filter, and project in a very terse way. My brain is used to parsing and understanding complex queries, and I know that one of my shortcomings as a developer is writing unapproachable LINQ statements. Traditionally, debugging LINQ has been pretty complex and the advice in the Microsoft documentation is pretty scant. You can debug by selecting chunks of the query at a time and evaluating them in the quick watch or watch windows. This leaves something to be desired.
OzCode has a nice visualizer that will show how the data in a LINQ query is altered at each step. Here you can see a query that takes a bunch of words, filters them for length, grabs the first letter, groups them, and finds the largest count.
The query is displayed as a series of panels showing the state of the data after a step has been taken. There is currently only support for visualizing full-framework LINQ queries but support for .NET Core is on its way.
A well-designed method in functional programming has no side effects. That is to say, you can run the same function multiple times with the same inputs and the results will be identical. This is called a pure function and it enables all sorts of fun with caching and optimizing. Unfortunately, most functions we encounter are not pure and may well have a side effect. Consider this function:
static int hitCounter = 0;
public static int GetAndIncrement()
{
    return hitCounter++;
}
Every time this function is called, the result is different: 0, 1, 2, 3. This is true if you’re evaluating the function in a quick watch window too.
Every time the function is evaluated there is a side effect of the hit counter is incremented. This is an easy condition to hit when debugging your code. To avoid changing the state of the running program while we’re debugging, we can add “, nse” to the expression.
If you’re working on a project that isn’t using the full version of Visual Studio, then you can still get a rich debugging experience by leveraging Visual Studio Code. The debugging experience in VSCode isn’t quite as good as that of full VS, but it is still jolly good. The swish tools found in OzCode haven’t made an appearance in VS Code yet. You can debug a whole host of different languages using VSCode: from Java to Python to C#, and all of them are supported through a series of plugins. The documentation on how to start debugging is also great and might be the only starting point you need.
This is probably the single most important thing you can do to debug your code. Find a friend, a coworker, or an inanimate object, and talk about the problem you’re having. I find that simply the act of getting my thoughts together sufficiently to explain the problem to somebody else is enough to point me in the direction of a solution. Sometimes the simplest solutions are better than a world of slick debugging tools.
Stackify's APM tools are used by thousands of .NET, Java, PHP, Node.js, Python, & Ruby developers all over the world.
Explore Retrace's product features to learn more.
If you would like to be a guest contributor to the Stackify blog please reach out to [email protected]