The 3 Types of Node.js Profilers You Should Know About
By: Ben
| March 17, 2023
Node.js is similar to many other coding languages in the sense that it needs to be used in conjunction with the right Node.js profilers and other tools to debug your program, overcome any bottlenecks, and optimize its functionality. With the right Node.js profiling, you can achieve this goal without a hitch, although none of them are perfect.
In coding, a profiler is a dynamic program analysis software that measures the efficacy, frequency and duration of function calls. These programs are capable of measuring the space, time complexity of a program and usage of particular instructions in order to optimize the program.
Here are the 3 different types of Node.js profilers, and what you should know about them:
Standard Profilers
Tracing Profilers
APM (Application Performance Management) Tools
Standard Node.js profilers
Standard sampling profiling gives you a big picture idea of what’s working within your program and what isn’t. This technique monitors factors such as CPU, memory usage, time spent per line of code, and frequency of method calls.
These profilers consist of periodically recording stack traces of your application. With sampling, you can get a good idea of any bottlenecks and functionality issues existing within your app, covered in a number of metrics that help you streamline the debugging process.
Examples
WebStorm
V8
Pros
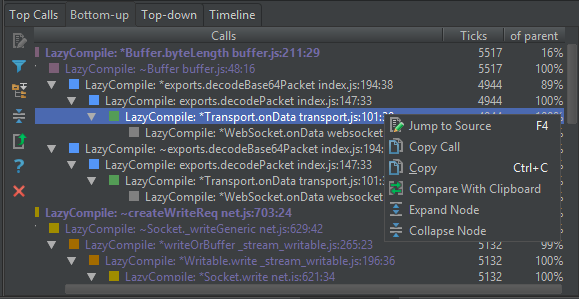
With Node.js, the periods between records are measured in ticks, which are conventional units.
Some of the other metrics covered by tracing profilers include total, which is the total number of ticks (the time) covered during which a function was executed or an activity was performed. They also look at Total%, which is the ratio of a function’s or activity’s execution time relative to the entire time when the measurements were made.
Self refers to the pure execution time of a function or activity without considering the time spent on executing functions called by it. The self% is a metric that measures the ratio of the pure execution time of a function or activity in relation to the entire time when the measurements were made.
Of parent refers to the ratio of the pure execution time of a function to the execution time of parent function that called it.
Sampling profilers build call trees and displays them in separate panes based on the collecting profiling data, which allows you to analyze the application execution from which calls were time-consuming (heavy), and by displaying the entire call hierarchy with the functions that serve as execution entry points at the top.
Cons
Stopping and restarting profiling during the execution of an application is not supported, requiring you to wait until it has processed.
Sampling profilers do not offer great accuracy or precision as snapshots are taken at random moments. This means that any function can happen to be recorded in a snapshot, without it necessarily fully detailing the pressing issues in your application.
Sampling can give you a rough picture of where most of the time is spent, but accuracy is not its strong suit.
This type of profiling can also cause delays into the execution, influencing the profiling results.
Node.js tracing profilers
Examples
Spy-js
Tracing profilers require developers to actively record tracing information by themselves directly into the code. These profilers find performance and application problems in a more exact manner.
Tracing profilers record all function calls and they are designed to reduce costs. These allow you to actively record tracing information by yourselves, directly into the code. There are several advantages to this method, although more information often results in more room for errors.
Pros
These can measure a number of metrics that include call times, memory usage and object allocations.
They are relatively easy to set up.
With tracing profilers, you get exact measurements of how much time each method took, offering you a more comprehensive debugging experience.
Plus, this tool allows you to count how many times the traced method was called.
Cons
They consist of a fixed amount of every function call or line of code executed, which can lead you to making incorrect decisions.
These profilers have a limit to what they can monitor, and they can slow down your program considerably due to how comprehensive it is.
Having more data also means a bigger result distortion compared to sampling.
Tracing also means that the profiling delay depends on the code and the places where you made tracing measurements. If a traced method is called inside other traced methods at the same time, all inner delays will be amassed for the outer method, which could make it difficult to separate the execution time from tracing distortion.
This type of Node.js profiling is designed to identify and solve Node.js application performance issues down to the line of code. These can show you every element of your code and its success from the end user experience to server monitoring. Plus, they can trace slow database queries, third party APIs, caching layers, background jobs and more.
Pros
These find and fix memory leaks and CPU bottlenecks.
They debug distributed transactions with end-to-end (E2E) tracing.
They can trace distributed call-chains.
Help to avoid security leaks and bad npm packages.
Gain specific line-of-code visibility to pinpoint even the smallest errors with error stack traces.
Get alerts on application errors and exceptions, and fix these before they affect your program.
Cons
These customized applications are not as intuitive as the other ones, and they are also not as renowned, requiring some time for the user to learn them.
You may have to wait for enough data points to come in before you stop seeing false positives, which may happen frequently.
Which profiler fits your needs?
Choosing what type of Node.js profiler really depends on what your company’s needs are and what your budget looks like. Are you seeking a more comprehensive, but perhaps slower breakdown of all your bugs and bottlenecks? If so, a sampling Node.js profiler is the way to go, as long as you’re patient and meticulous.
A tracing profiler is the leaner method, but they have their limits in terms of what they can monitor in terms of your program’s performance. An APM profiler is also great as you can create your own metrics on a customized dashboard, but these require quite a bit of time to learn and master that you may not have. Stackify’s Application Peformance Management tool, Retrace keeps applications running smoothly with APM, server health metrics, and error log integration. Download your free two week trial today!
Your Node.js profiling choice should depend on what your timetable, budget and needs look like, as there is no one-fits-all solution to optimizing your programming practices.
Stackify's APM tools are used by thousands of .NET, Java, PHP, Node.js, Python, & Ruby developers all over the world. Explore Retrace's product features to learn more.