
Log management is traditionally described as a way to collect all of your log data in one place so you can use it for a wide variety of uses. Using log data for troubleshooting application problems is just one use case. You could also take machine data from a phone system or MRI machine and use log management products like Splunk to analyze them for various purposes. Another popular category for log management tools is SIEM, which is more security related.
Developers have specific and different needs than other use cases for log management. Retrace APM with log management aims to create the perfect product and user experience for developers.
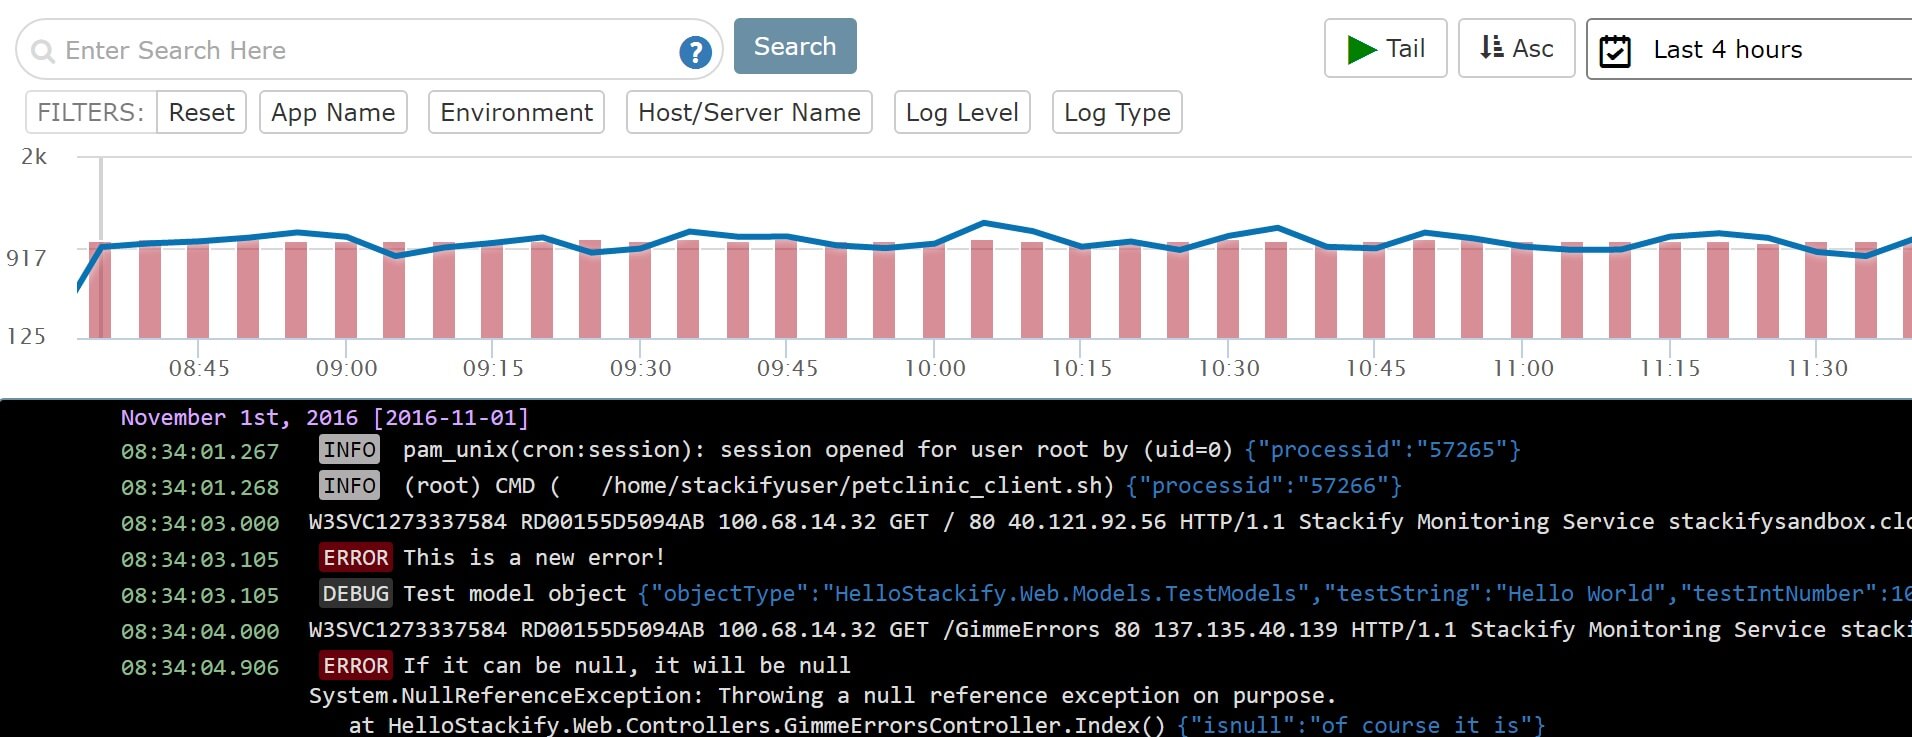
Application and server logs are typically the eyes and ears for developers when it comes to troubleshooting application problems. Retrace provides developers with a unique log management experience by fully integrating application logs and errors together.
Traditional log management solutions do not provide any features around tracking and identify application errors. Other solutions like Splunk or even your own ELK stack do not provide the robust error tracking functionality that developers require. This forces developers to use multiple logging tools.
It is nearly impossible to correlate a single web request to its corresponding errors and logs across multiple tools. Retrace makes this simple with one integrated solution that automatically matches up errors and logs for the same transaction together.
Key features that developers need in a logging service:
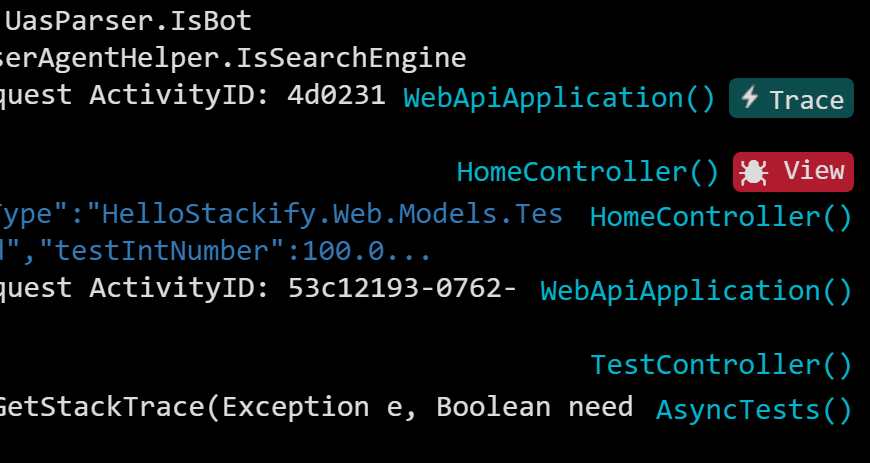
Retrace goes way beyond correlating application logs with errors by fully integrating the experience with their APM transaction tracing capabilities. Now developers can see logs and errors grouped by individual web requests along with the SQL queries, HTTP calls, and much more that also occurred.
When you have multiple users using your application at the same time, all of their logging gets intertwined in your logs. Sorting through your logs to figure out which log statements go together for a single web request is a huge headache. Retrace solves this problem by linking all of your log messages together by a unique transaction identifier.
By linking your log messages together with web requests you can gain more context about what was occurring. Details like the MVC action name, domain name, querystring, and etc can potentially provide more context as to who the user was and what they were doing.
Code level transaction tracing, including your logs, provides a wealth of information about exactly was going. Retrace can show you the SQL queries, HTTP calls, cache keys being used and more all for the same web request or transaction. Now you can go from a random log statement or error in your code to know exactly which SQL statements ran before the error.
You can Retrace what your users are doing! It’s pure genius!
Try our free profiler, Prefix, on your workstation to see the full power of what Retrace can do on your servers. Prefix makes for an amazing log viewer for developers.
Go beyond saving a basic log message to separating out key data, in a structured way, that can be useful for searching and log analysis. It doesn’t really take any more time to do and can enable an amazing amount of functionality from your log data.
For example, if you write a log message like this, you could later search by this clientid field within the Retrace log management system. This simple change could make it possible to search across all of your logs by your customer’s clientid field. You could also get some statistics about how often you log “11 records” and other log analytics capabilities.
log.Debug(“Incoming metrics data”, new {clientid=54732, records=11});
This is just one simple example. To learn more: What is structured logging and why developers need it
Retrace goes beyond simple log searching to provide special features designed for developers.
Full text searching is available for your log messages as well as filtering on any fields captured. Several quick filters are easily accessible for things like app name, environment, server name, log type, and log levels. “redis level:error” to find redis errors
Under the hood Retrace uses Elasticsearch. You can use the full power of it and lucene’s query syntax. Including regex queries. “/.*exception/” to find any message with the word Exception in it.
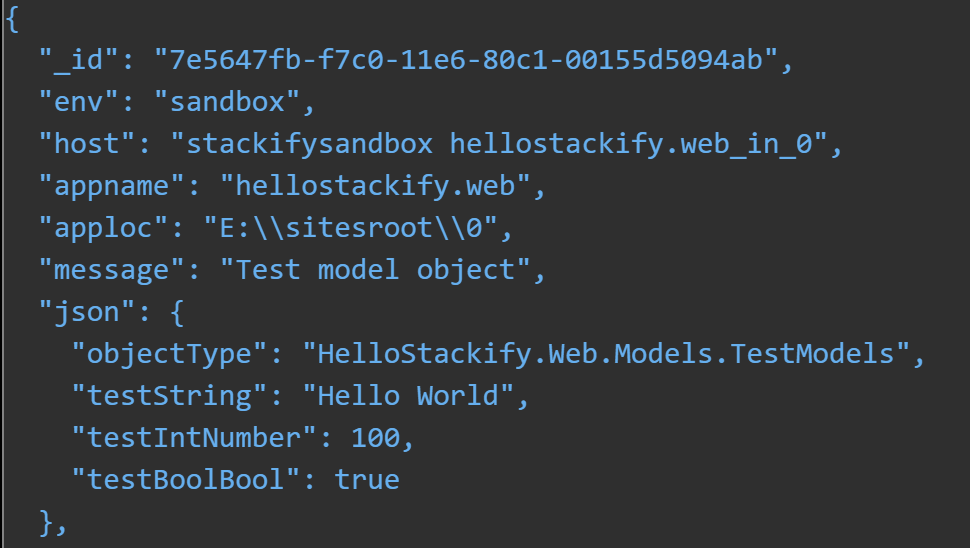
Take advantage of Retrace’s support for structured logging objects to log additional fields within your log messages. You can view these additional fields in a JSON format. Any of these fields can be filtered on.
The log viewer’s feature for exploring log fields will show you what custom fields are being logged. You can also use some log analytics functionality to see how often the fields are used and what type of values are being logged.
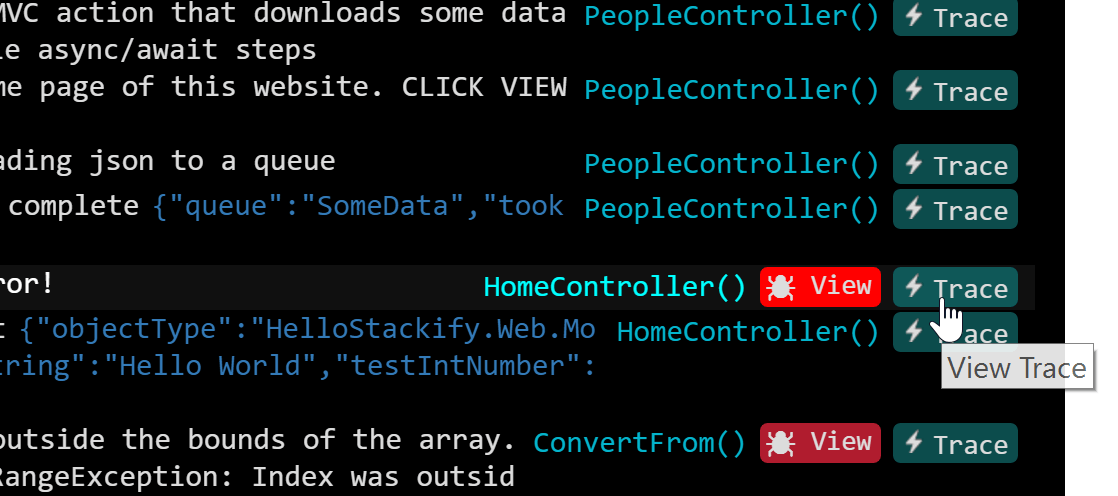
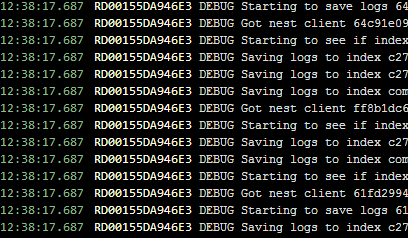
Perhaps the most low tech feature, but it could be one of the most helpful! Viewing your logs, just like your source code, all in one color makes it hard to quickly find things.
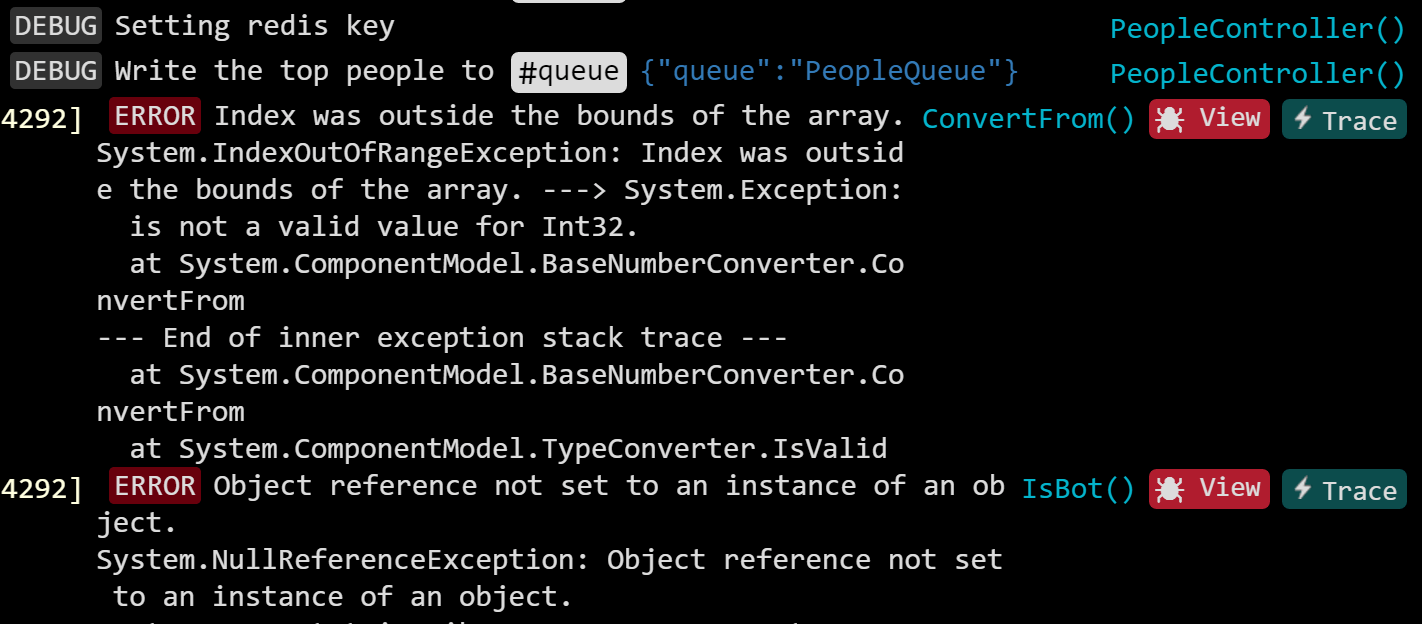
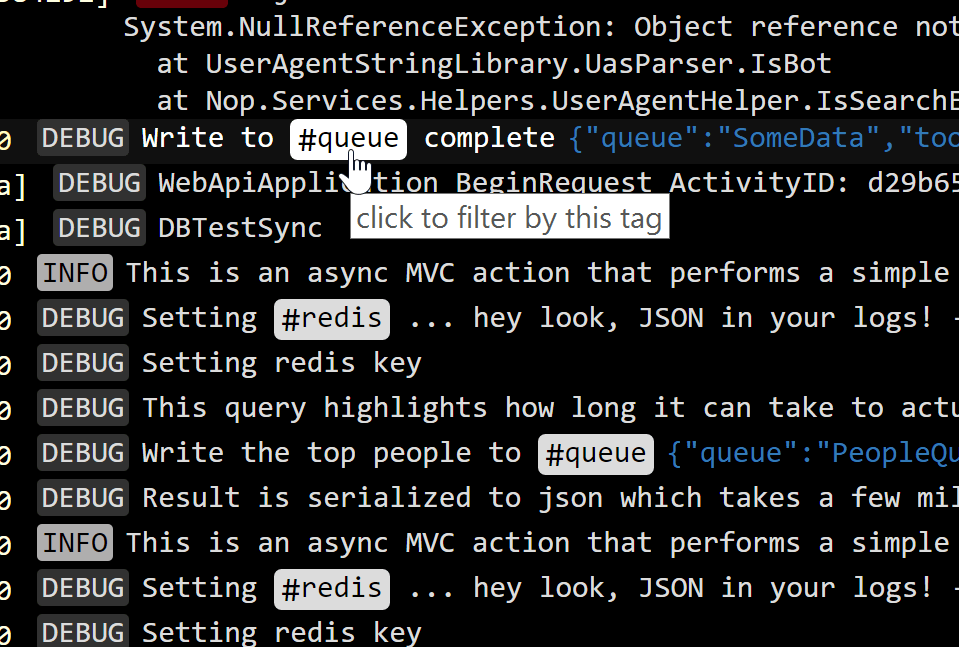
Log levels are automatically colored differently to draw attention to errors and warnings. Custom objects are showed as a different color and as JSON.
Some logging frameworks can track and report where the log messages originated from in your code. Being able to track where your logs come from can be very valuable for tracking down bugs.
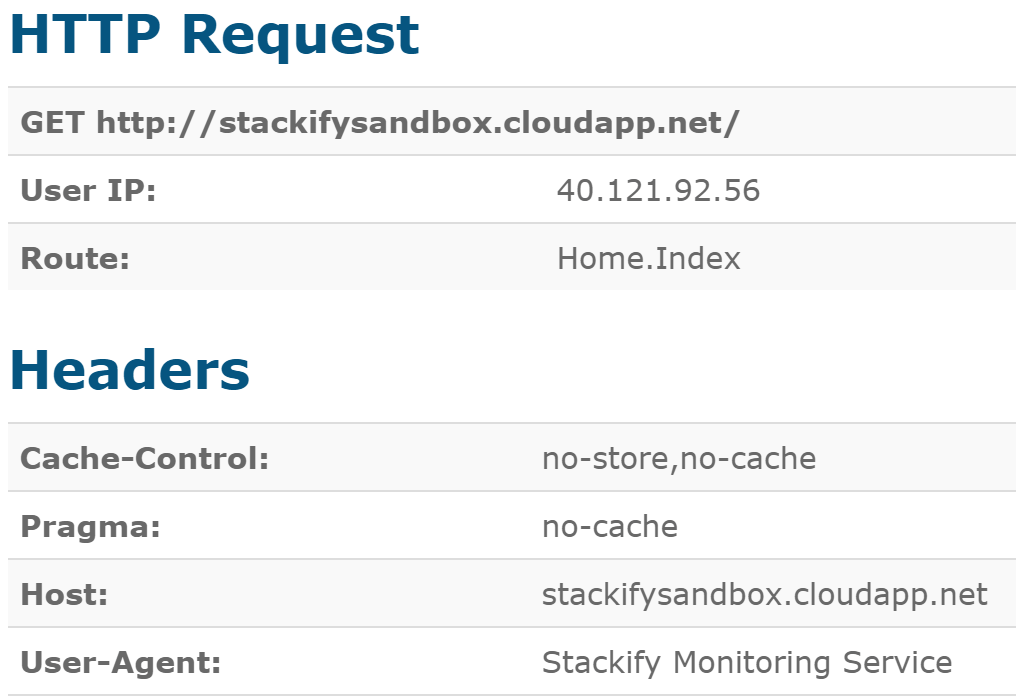
Retrace integrates log management with it’s APM transacting tracing functionality. This provides incredibly detailed traces about your web requests or transactions.
The traces include web page was hit, SQL queries executed, external HTTP web service calls, and much, much more.
When errors are logged to supported logging frameworks like log4net and log4j, additional details about the current web request can be collected. Depending on the logging framework being used, the complete stack trace, URL, headers, querystring, post data, and much more can be collected. All of this data is easily viewed within Retrace’s log management functionality and in the error tracking dashboard.
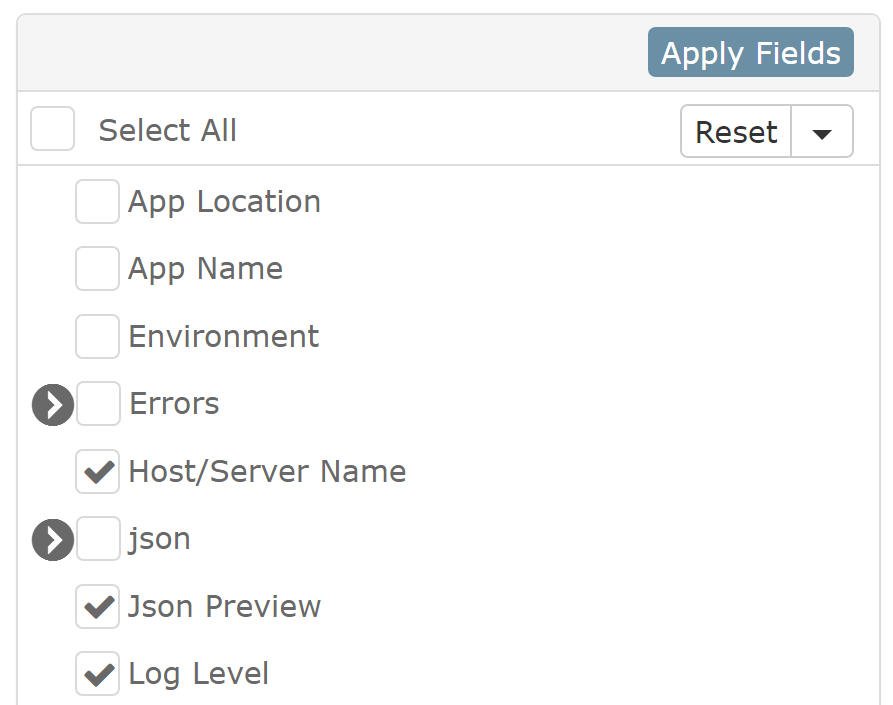
Retrace has many built-in fields for basic server info, errors, web logs, and Windows events. The field explorer makes it easy to see all the fields that exist and add them to log viewer for display.
The field explorer is also very useful for seeing what custom fields you are logging. They show up under the “json” section.
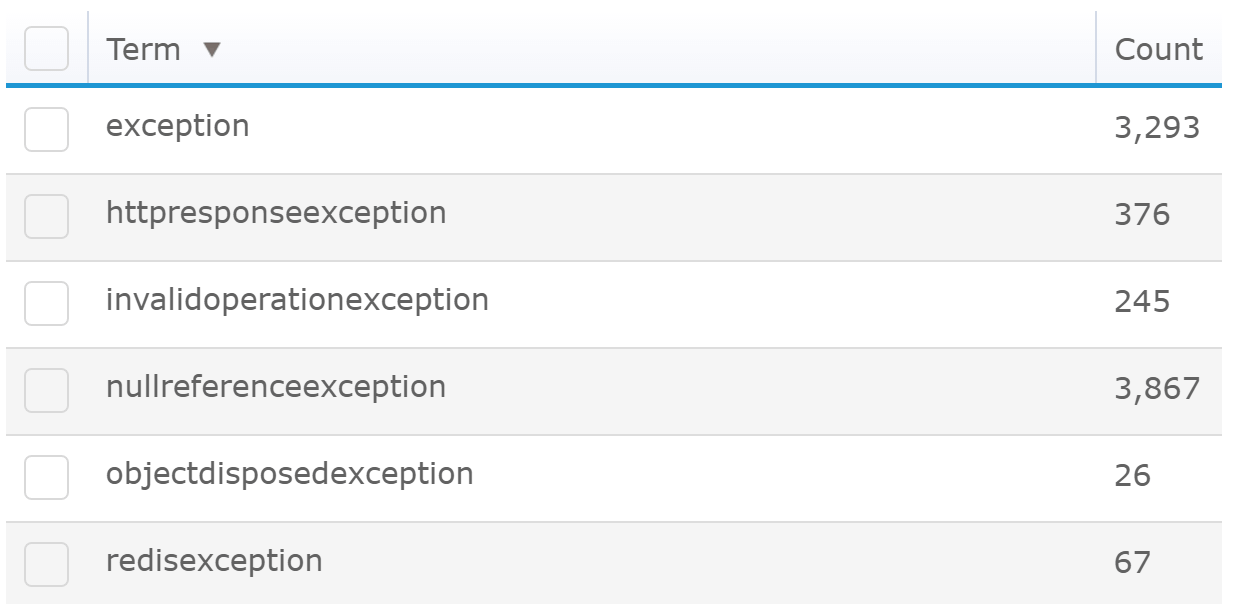
For any field you can track every value that is being logged and how often it is being logged.
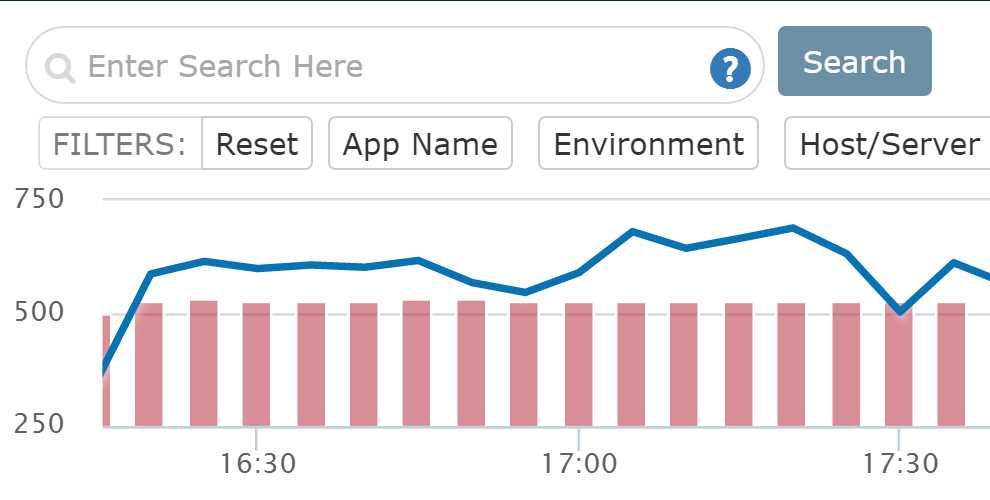
This is especially useful for a simple example like a type of error. For a specific time range you can quickly see how many times each type has happened.
Another great use case is for web logs. You can see how many times a specific IP address has accessed your server.
Trying to troubleshoot something in production? Use Retrace to search and filter for exactly what you are looking for and then turn on tailing mode. The log viewer will automatically update with new logs.
For example, you can search only for errors “level:error” and watch errors from your apps stream in. It is almost beautiful!
All you have to do is put a # in your logs and Retrace will take care of the rest. Tags will be specially highlighted in your logs and you can quickly click on them to filter by them.
Tag log messages by subject or functionality and make it easy to #search logs by function. This works especially well for logs across multiple applications that all assist in the same type of functionality or transaction.
Tagging works great in combination with our log monitoring features.
If you log it, you can monitor it with Retrace log monitoring features
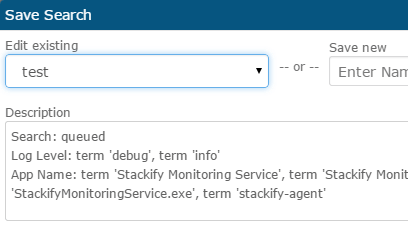
Search your logs for exactly what you are trying to find and save it within Retrace. You can then setup a monitor to run this query every few minutes and alert you if it finds a certain amount of results.
If your app logs a certain message that is really important for you to be aware of, this is an invaluable feature.
Log files work great until you need to search your logs across multiple servers. Another alternative that some developers employ is saving all of their logs to a SQL database table. If you have ever tried to query that SQL table, you know how unwieldy and impractical storing log messages in SQL is. Saving errors to a log file or SQL table is even worse because you have no way to uniquely identify distinct errors across all of the messages.
Log aggregation to a centralized logging repository is critical for any development team. Retrace leverages the power of Elasticsearch to allow developers to search across all of their logs extremely fast.
Sending your application logs to a logging service like Retrace is easy. If you are using a standard .NET or Java logging framework, you can easily add our logging package to your app. With some simple config changes, you can immediately send your app logs to the Retrace cloud logging service.
Stackify's APM tools are used by thousands of .NET, Java, PHP, Node.js, Python, & Ruby developers all over the world.
Explore Retrace's product features to learn more.
If you would like to be a guest contributor to the Stackify blog please reach out to [email protected]


