
Troubleshooting application problems are never fun. We would much rather be writing code on some cool new project. In this article, we will cover some tips on how to troubleshoot ASP.NET web applications.
ASP.NET troubleshooting topics:
Let’s start by reviewing how to troubleshoot site web application errors. These could be 503 services unavailable, 500 internal server error, or similar issues.
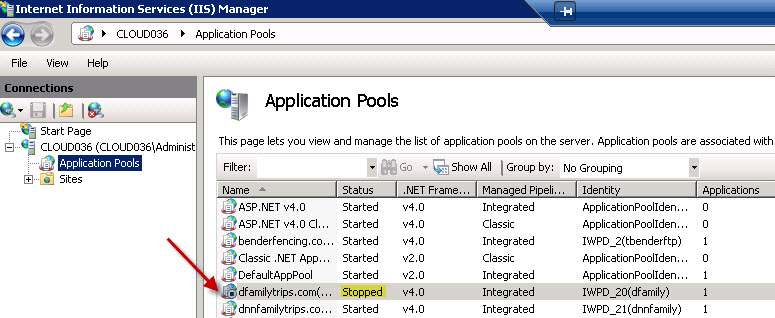
If your IIS Application Pool is stopped, you will get only 503 errors on every request. Sometimes your IIS Application Pool will switch to a stopped state due to w3wp crashing, configuration problems or other weird scenarios.
Make sure your IIS Application Pool is set to started.
To solve this issue, you need to quickly check your error logs. Depending on the issue and how you are doing exception logging, it might be getting logged to a file or your error tracking tool. You may also want to check Windows Event Viewer if you can gain access to it.
Learn more: How to Catch All Exceptions in C# & Find All Application Errors
If every page load throws an exception, you likely have a configuration problem in your Web.config or ApplicationHost.config. You could also have problems with your ASP.NET session provider, caching, or other application dependencies that are used on every single web request.
For example, if you use Redis or SQL Server as your ASP.NET Session provider and they are down, you could see exceptions on every page load. A similar issue could happen with a PageOutput cache provider.
If your application is throwing an exception on every page load, you are most likely not able to see the details of it. This makes it hard to troubleshoot ASP.NET problems. You probably see the standard ASP.NET error page (“yellow screen of death”) or your custom error page.
You could temporarily disable your custom error page and make ASP.NET show the full exception details. Please note that this could show potentially sensitive information. However, this could be helpful if your application is down and you need a quick solution.
Learn more: How to Use Web.Config customErrors for ASP.NET
If your ASP.NET web application is online, but the entire application is running slow, you could have a few common problems. Including a problem with an application dependency (like SQL Server, Redis, etc) or a spike in traffic. Let’s review how to troubleshoot these types of ASP.NET web application problems.
If your server CPU is pegged at 100%, your application is going to be running slow. You need to identify if your application itself is using all of the CPU or is something else going on.
I have seen problems several times over my career where Windows Update, Antivirus software, or a backup service was running and killing the server CPU.
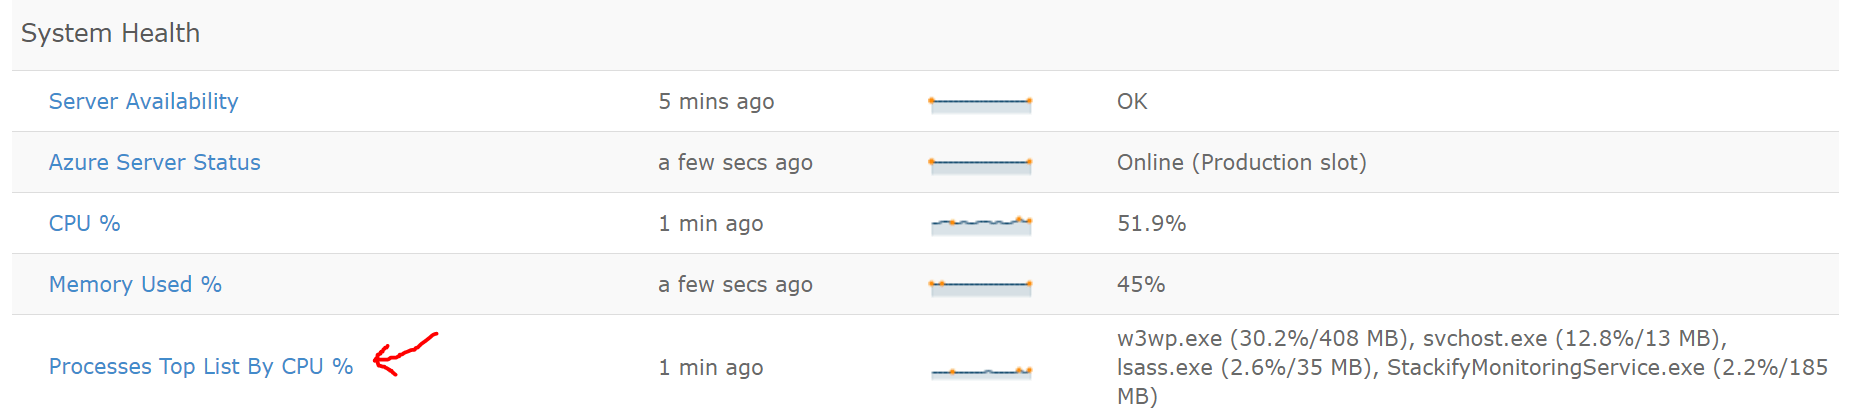
Make sure nothing is interfering with your application. Your server monitoring tool may give you visibility in to which applications are using the CPU, or you may need to remote desktop into the server to verify the CPU usage.
[adinserter block=”33″]
Exceptions are typically a developer’s first line of defense when it comes to identifying application problems. I highly recommend implementing strong C# exception handling best practices. You should review your error tracking tool, log files, or even Windows Event Viewer for exceptions that could be related to your application problem.
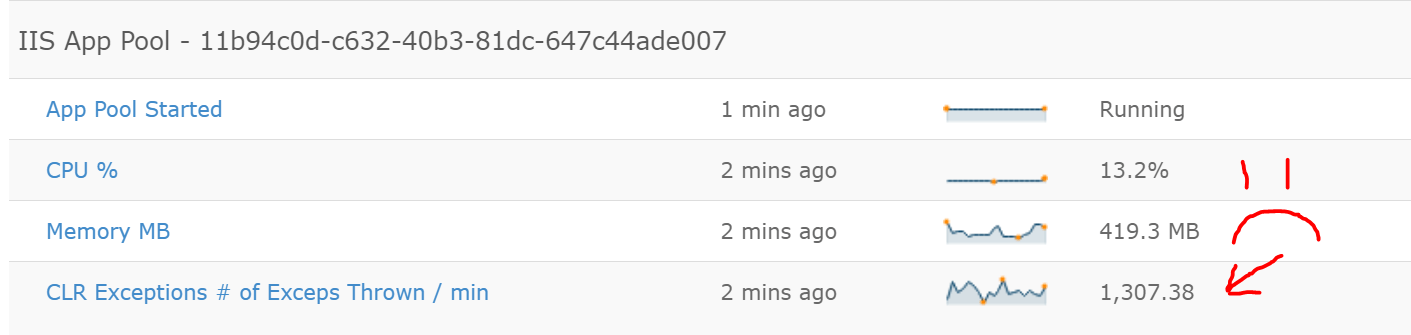
Another great suggestion is checking Windows Performance Counters for .NET exceptions. “CLR Exceptions # Exceps Thrown / Sec” is a great one to always monitor. Even when you can’t see the exception messages, the performance counter will let you know how many are occurring.
Exceptions can definitely be an indicator of application problems, and even hidden exceptions at a high rate can cause increased CPU usage.
In the example below, you can see that this application is throwing 1,307 exceptions per minute. Yikes!
Today’s applications typically use numerous application dependencies. At Stackify, we use SQL Azure, Redis, Elasticsearch, Azure Table Storage, Azure Service Bus, and multiple 3rd party web services. If any of these are down or are having performance problems, they can immediately impact the performance of our applications.
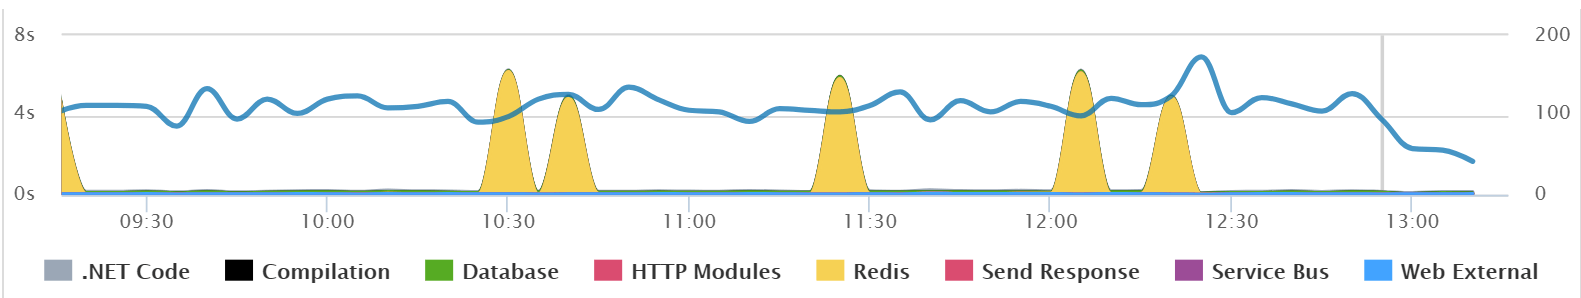
This screenshot below is from Retrace, our APM solution. One of the great features of Retrace is its automatic tracking of the performance of your application dependencies.
This sample application (shown below) occasionally has problems connecting to Redis. This chart below makes it immediately obvious that Redis is causing performance problems. (Retrace also shows the exact exceptions and which web requests are being affected.)
As part of troubleshooting your ASP.NET performance problems, you should review your top web requests. You want to know which requests are taking the longest and which is being called the most often.
Retrace has a great visual for tracking your top 5 web requests. It is really helpful for when a specific request is taking a large percentage of the overall time. This is the same example above about Redis. When connecting to Redis has a lot of performance problems, that specific web request takes all the time.
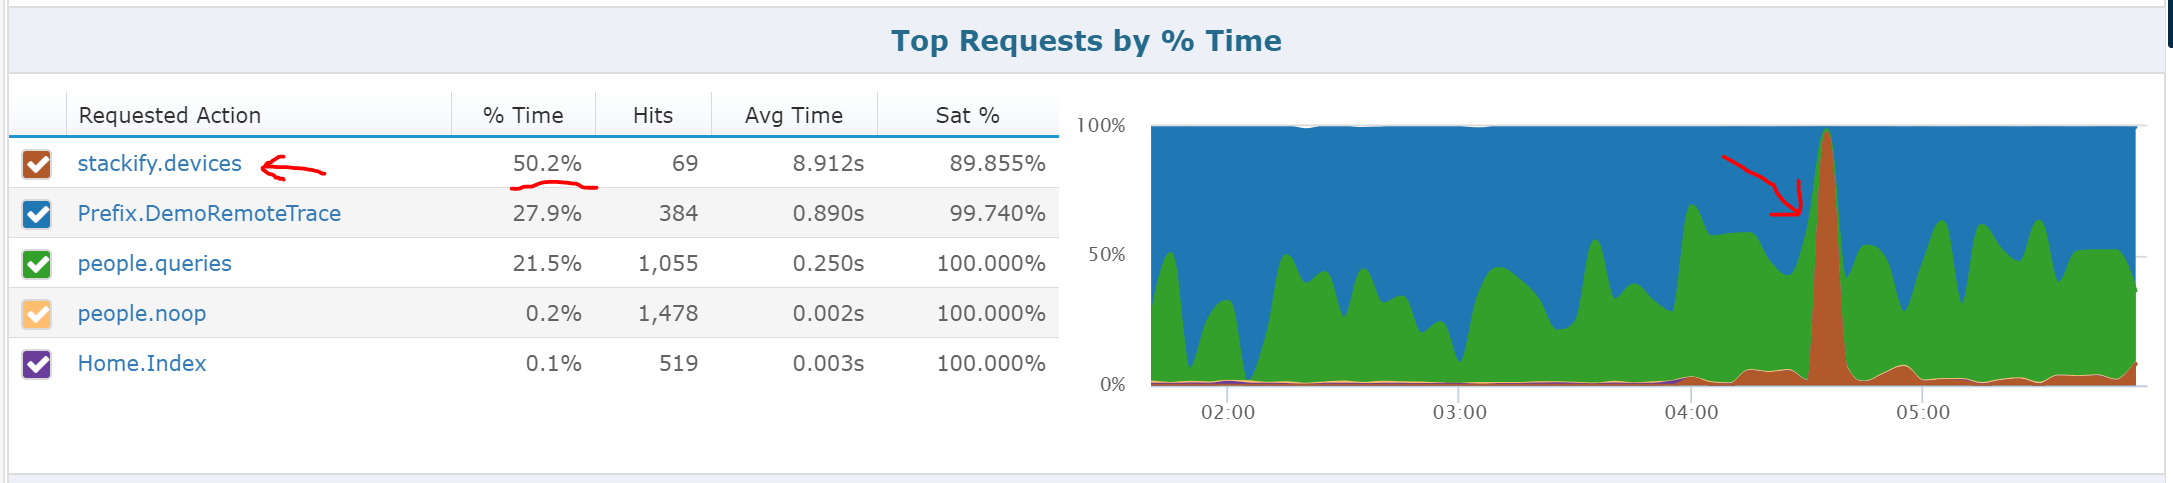
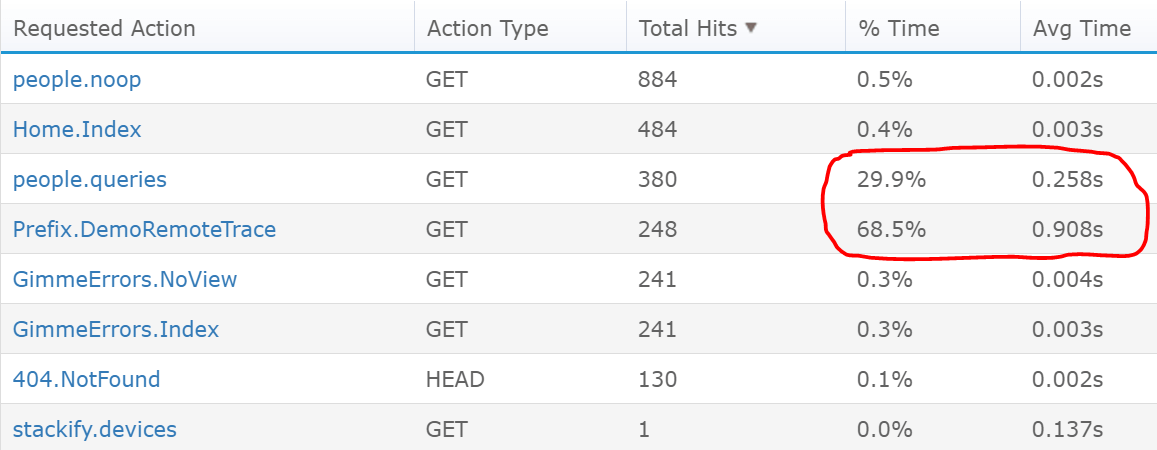
When reviewing all of your requests, you may have some requests that happen a lot but are extremely fast. You may have some others that happen less often but over the aggregate, take the most amount of time.
We all dream of being highlighted on Hacker News, Product Hunt, Techcrunch or some other site. When that day happens, it could also crush your web servers. Here are some tips for troubleshooting spikes in traffic.
IIS and ASP.NET provide several Windows Performance Counters that are helpful for measuring web server traffic. You should always monitor these with your application monitoring solution. Retrace monitors several by default and are always available for you.
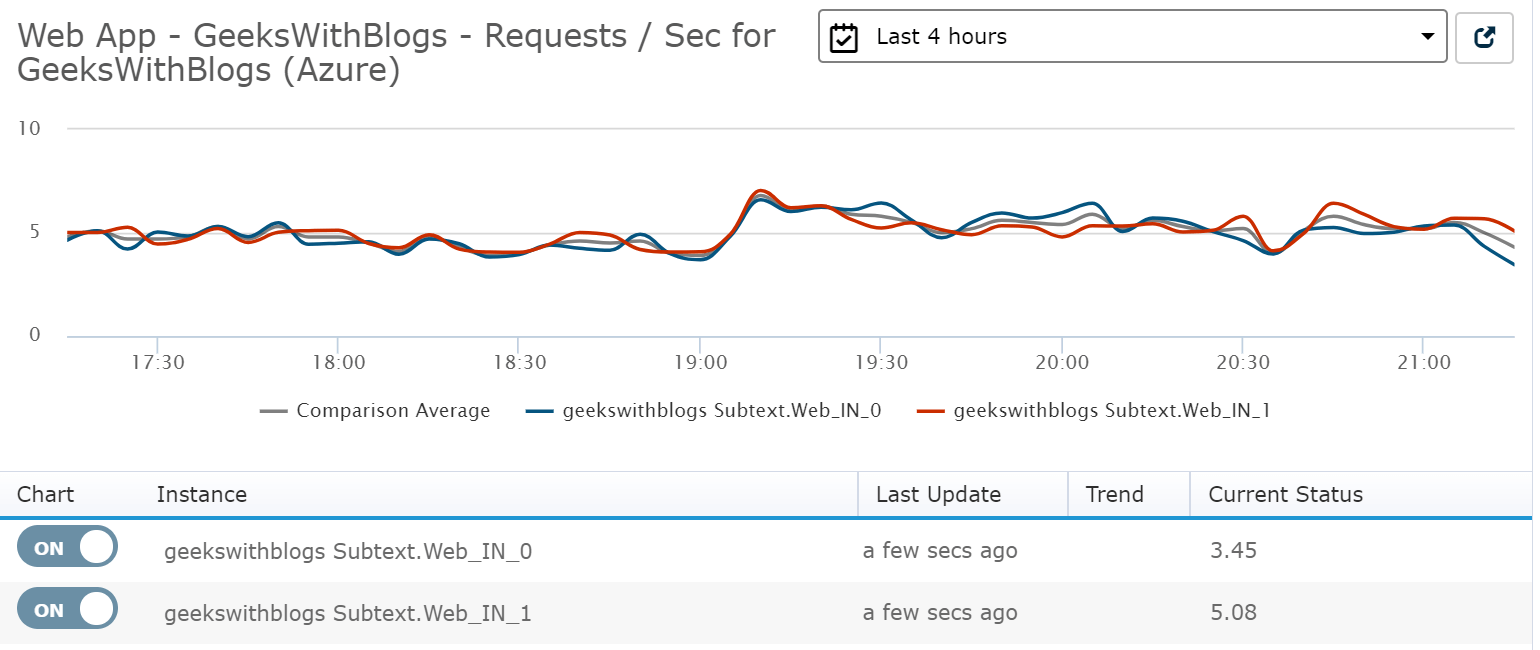
If you are using an APM solution, like Retrace, it may also be able to show you how many requests per minute your application is serving. They utilize lightweight code profiling that tracks every web request that happens within your web application.
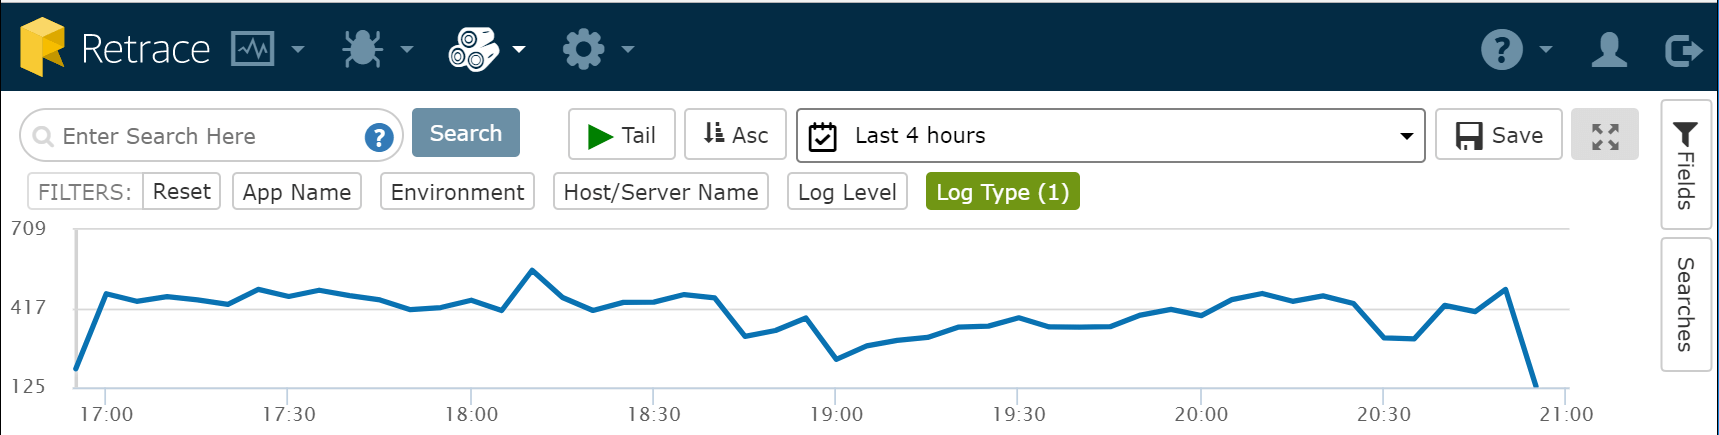
If you had no monitoring in place before performance became derogated, you can use your IIS logs to get an idea if traffic patterns have changed. Your IIS logs are located on your web servers and usually, a few hours or days of data are always there to review. You can use a free tool like Log Parser Studio to see how many requests you have had by the hour or minute over time.
Retrace has log management built-in and can help you search and visualize your IIS and application logs. Below is a visualization of the IIS logging rate over time for an application.
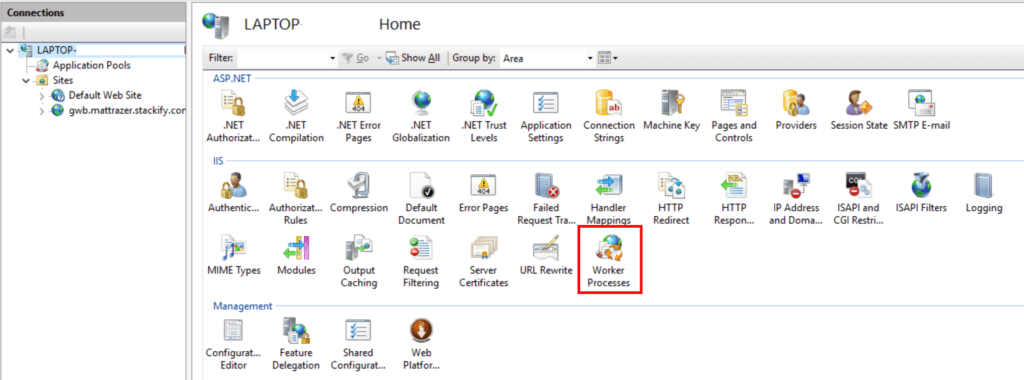
If you aren’t sure what is causing your performance problems, another tip is to look at the live requests within IIS. From the IIS Management Console select Worker Processes.
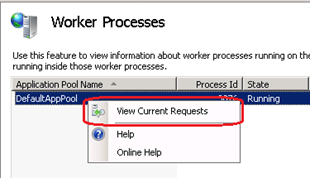
Right click on your running application pool and select “View Current Requests”.
This will bring up a list of the currently running ASP.NET web requests as shown below.
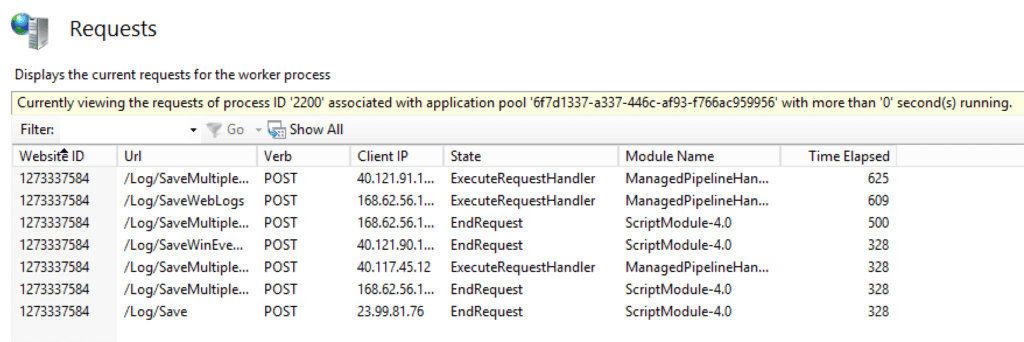
I would suggest looking at the “Time Elapsed” to see if you have a lot of requests that are taking a very long time. You should also see if they are all stuck in the same module. This could be a clue that the issue is all related to ASP.NET Sessions or some other step within the ASP.NET request lifecycle. You may also be able to identify a specific URL that is causing the problem.
Up to this point, we have focused on how to troubleshoot ASP.NET web application problems that were site wide. Most of the time, you are probably troubleshooting a specific web request.
Odds are, you are probably having one of these three problems:
We will review some tips to cover all three of those scenarios.
Anytime you are troubleshooting an application problem; your application logs can be a huge help. “Send me the logs!” is likely the first thing most developers would say. I would highly suggest using a logging framework like NLog, log4net or Serilog. You can then send them to a log management service to make it easier to search them across multiple servers.
Searching and tailing your application logs is really helpful for troubleshooting production problems. You can use a log management tool to view your logs in real time as you try and reproduce a problem.
If your web request is returning a 500 Internal Server Error, you need to check your server-side logs for exceptions. As mentioned above about application logs in general, it is important to have good exception handling in place and properly logging all of your errors. You can then also send all of your exceptions to an error monitoring service like Retrace.
If you do not have good logging in place, you should check Windows Event Viewer to see if it shows any .NET exceptions. Worst case scenario, you may need to disable web.config customerrors or remote desktop into the server to show the full exception.
If your web request uses SQL Server, Elasticsearch, or some other application dependency, there could be a problem with it. This also includes 3rd party HTTP web services that your code may be calling. Applications that heavily use microservices will have problems if one of those microservices is offline or slow.
The easiest way to find problems around these dependencies is if they are throwing exceptions. If they aren’t, you may need to use an APM solution, like Retrace, to profile your code so you identify what your code is doing.
The hardest problems to troubleshoot are the ones where your code is simply acting “weird” or not doing what it is supposed to do. Application logging is one of the most important tools you have to troubleshoot these types of problems.
Remote debugging is another option but could add further performance problems. Microsoft has multiple tools available including Visual Studio remote debugging, Intellitrace, and the Snapshot Debugger for exceptions.
Another technique that can help is custom application metrics. For example, at Stackify, we track the batch size of log messages being sent to our API. Being able to track and trend that batch size can be helpful to know if the data being sent to us has suddenly changed. We have a great article dedicated lots of examples of how custom application metrics could help.
The best way to troubleshoot any ASP.NET web application problem is via lightweight code profiling. The reason we call it Retrace is that it can literally retrace what your code is doing.
The transaction traces that we collect cause very little application overhead and they are a huge lifesaver when it comes to troubleshooting ASP.NET web application problems.
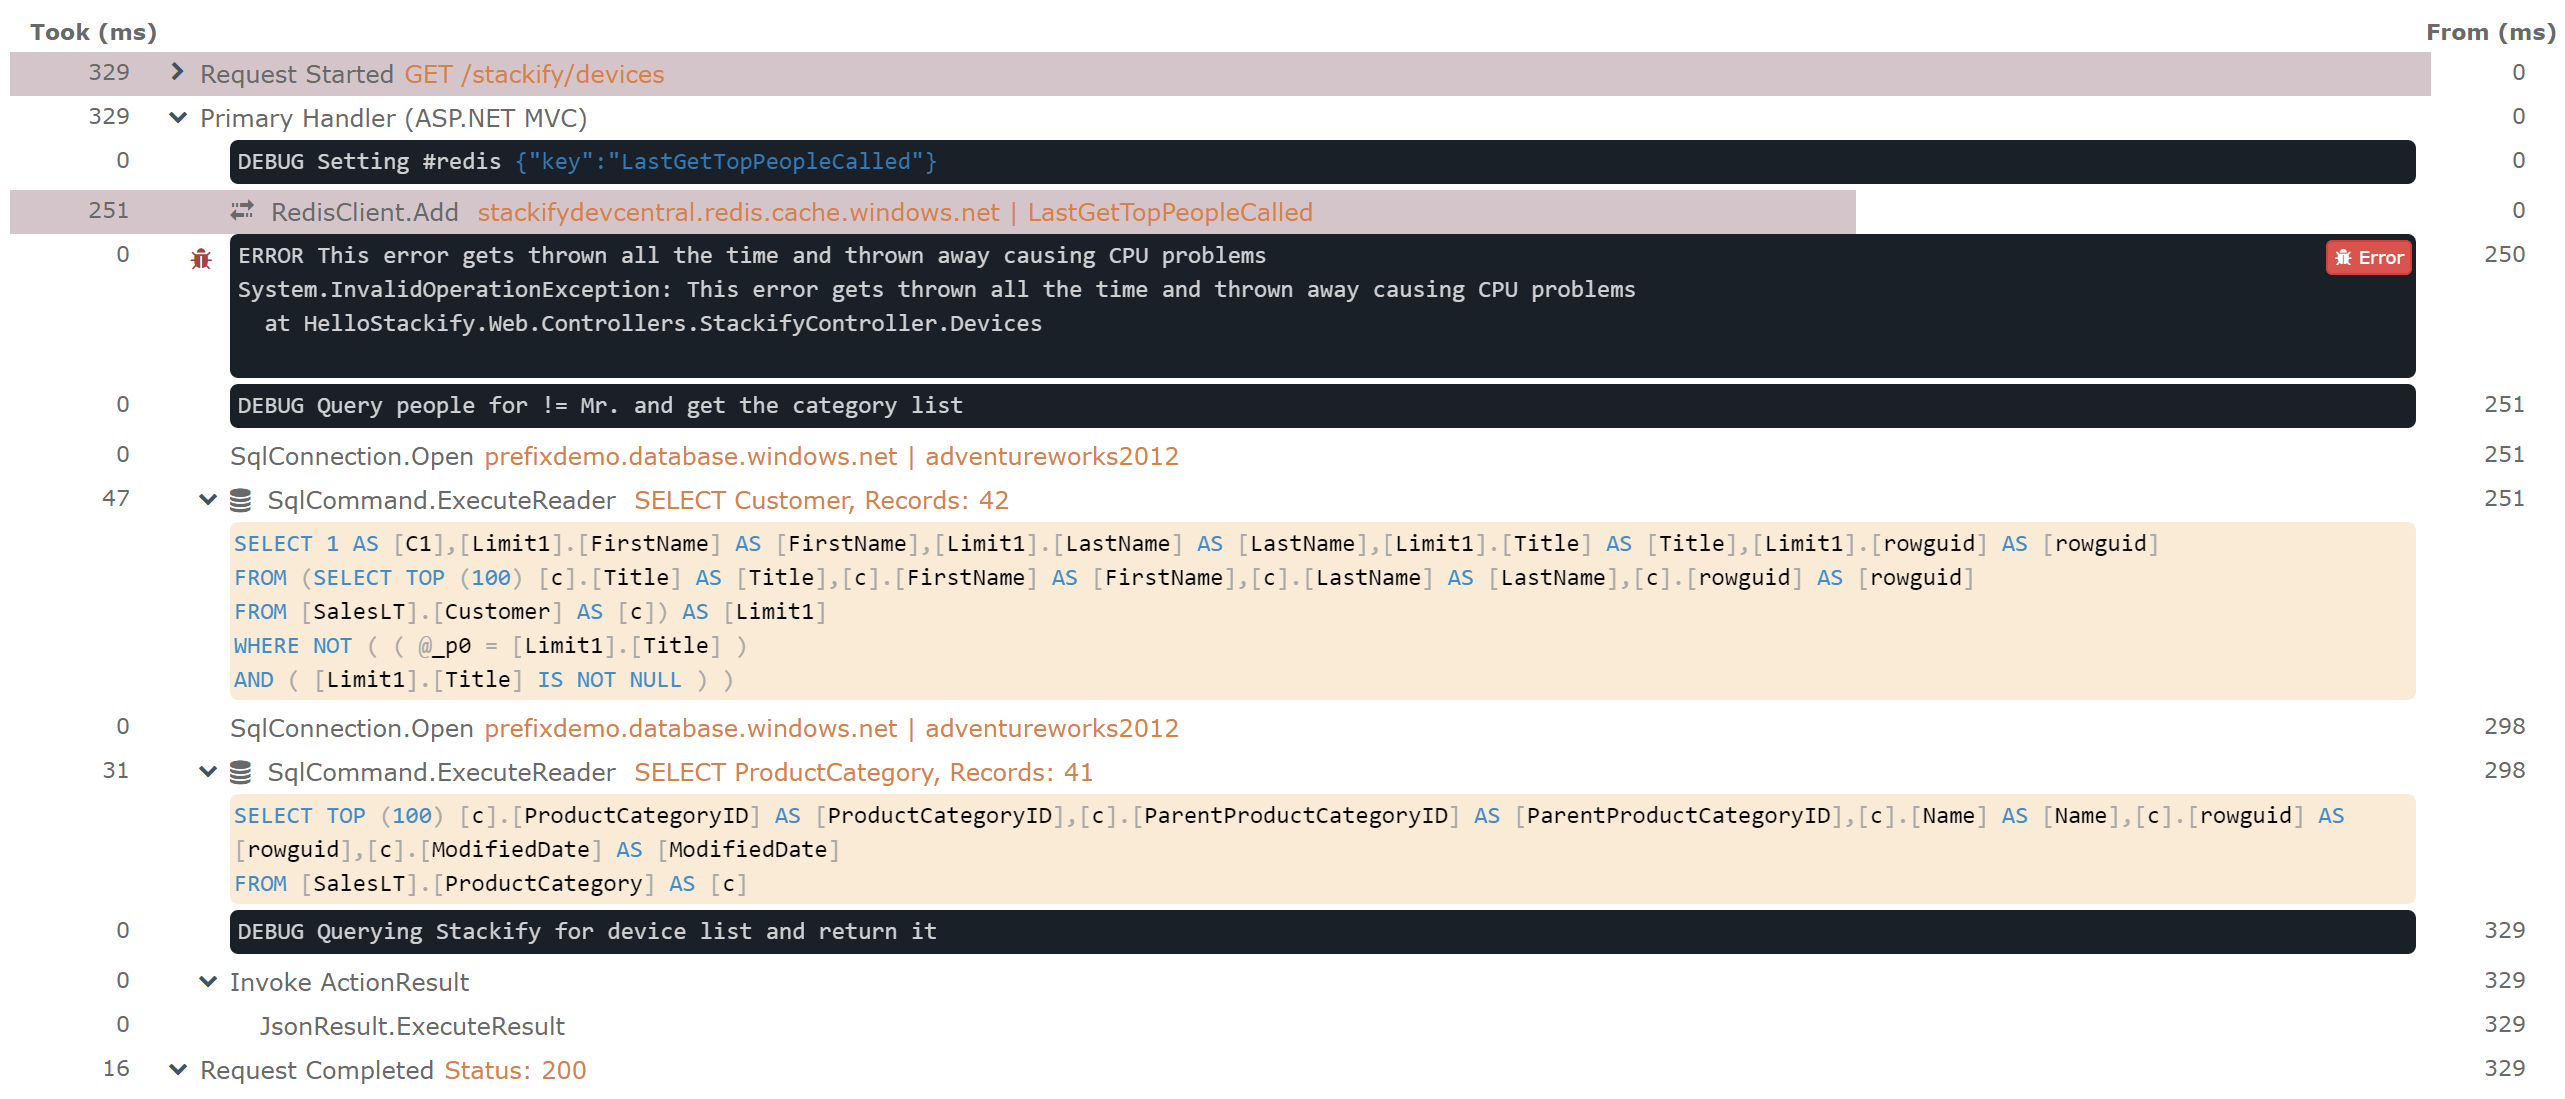
Here is an example below of the types of traces that Retrace collects. It allows you to see your errors, logs, SQL statements and much more all in the context of a specific web request.
By the way, we provide a free tool called Prefix that you can use on your workstation to view these transaction traces as you write and test your code. Retrace is for your QA and production servers.
In this guide, we reviewed how to troubleshoot ASP.NET web application problems. Including problems that may be affecting your entire application as well as specific web requests.
Retrace is designed for troubleshooting application problems. It provides a holistic approach to application monitoring. Including light-weight code profiling, application logs, error tracking, and application metrics.
Get started today with a free trial.
Related Articles:
Stackify's APM tools are used by thousands of .NET, Java, PHP, Node.js, Python, & Ruby developers all over the world.
Explore Retrace's product features to learn more.
If you would like to be a guest contributor to the Stackify blog please reach out to [email protected]