
Internet Information Services (IIS) uses a pool of worker processes (w3wp) to run ASP.NET web applications on Windows servers, but dealing with them crashing is no fun. The good news is, we are here to help provide you with resources on how to isolate and solve these issues, including how to identify crashes, capture crash dumps, and interpret them.
Stackify provides tools to help developers monitor and optimize the performance of their ASP.NET applications like Retrace. Our engineers have spent a lot of time troubleshooting w3wp crashes. In this article, we want to share some of that knowledge.
This article covers these topics:
Any process running in Windows can be terminated due to unexpected errors. If you create a new .NET console application and do nothing other than throw an exception in Main(), then the process will terminate unexpectedly.

So what happens if an unhandled exception occurs in an ASP.NET application?
Like most things, it depends. If the exception is thrown in the context of an HTTP Request, even if you don’t handle it, that request is wrapped and will catch all unhandled exceptions as part of the HTTP Exception handling for the request. The will not cause the worker process to end.
However, unhandled exceptions occurring in contexts not part of the HTTP Request will trigger the process to end: this could occur on a timer thread, background thread, or a callback function.
In fact, in early versions of .NET 4.5 this was a common occurrence in using async/await patterns but has thankfully been fixed since patched to behave the same as the HTTP Request scenario.
Note that there are exception types which can cause the worker process to crash, even when thrown in the context of an HTTP request: stack overflow, access violation, out of memory, etc.
If your app has any dependencies on unmanaged code, unhandled exceptions in that code can just as easily cause the process to terminate.
Unfortunately, you may have identified a w3wp crash by way of upset users reporting that your web application isn’t working, or is slow (due to excessive app pool recycles).
All application crashes within Windows get reported to the Windows Error Reporting (WER) service. They also get logged to Windows Events and can be seen in the Windows Event Viewer.
About Windows Error Reporting: WER is built into all versions of Windows from 2008 and on. It uses some rules to collect crash dumps from faulting processes and can check for solutions, and send problem reports back to Microsoft. The default configuration is difficult to customize, which is why other tools, such as DebugDiag are generally recommended. The main benefit is the communication with Microsoft, which makes it more of a Windows tool and it won’t be entirely useful for determining why your application has crashed.
Fortunately, you can monitor crashes with Retrace’s log management capabilities. Retrace can ingest your Windows Event logs that would contain this information. You can configure monitors in Retrace to watch your Windows Event logs and alert you whenever a crash is found.
From the over-simplified example above with a console app, you can see the events around our crash in the Windows Event Viewer:

and

The first exception shows the unhandled .NET exception. Since it wasn’t handled and logged anywhere, it lands in the event viewer with the appropriate call stack.
The second exception demonstrates that the .NET runtime is terminating the process since it was not handled.
For a web application that has crashed, you will see similar errors in the event viewer. In this example, I have created a web application and have an unhandled exception that I know will cause the process to terminate:
An unhandled exception occurred and the process was terminated.
Application ID: /LM/W3SVC/2/ROOT
Process ID: 35940
Exception: System.AccessViolationException
Message: You can't do that. No, you can't do that.
StackTrace: at WebCrash.Controllers.Foo.Bar() in C:\projects\ThrowException\WebCrash\WebCrash\Controllers\HomeController.cs:line 42
at WebCrash.Controllers.HomeController.<>c.<About>b__1_0(Object x) in C:\projects\ThrowException\WebCrash\WebCrash\Controllers\HomeController.cs:line 25
at System.Threading.QueueUserWorkItemCallback.WaitCallback_Context(Object state)
at System.Threading.ExecutionContext.RunInternal(ExecutionContext executionContext, ContextCallback callback, Object state, Boolean preserveSyncCtx)
at System.Threading.ExecutionContext.Run(ExecutionContext executionContext, ContextCallback callback, Object state, Boolean preserveSyncCtx)
at System.Threading.QueueUserWorkItemCallback.System.Threading.IThreadPoolWorkItem.ExecuteWorkItem()
at System.Threading.ThreadPoolWorkQueue.Dispatch()
at System.Threading._ThreadPoolWaitCallback.PerformWaitCallback()
As you can see, my callback function throws an access violation, and it causes the process to crash! But, because it’s happening outside of the HTTP request context, it doesn’t even need to be as severe as an access violation to cause the same behavior.
An unhandled exception occurred and the process was terminated.
Application ID: /LM/W3SVC/2/ROOT
Process ID: 65576
Exception: System.Exception
Message: Just a plain ol' exception, and is unhandled.
StackTrace: at WebCrash.Controllers.Foo.Bar() in C:\projects\ThrowException\WebCrash\WebCrash\Controllers\HomeController.cs:line 42
at WebCrash.Controllers.HomeController.<>c.<About>b__1_0(Object x) in C:\projects\ThrowException\WebCrash\WebCrash\Controllers\HomeController.cs:line 25
at System.Threading.QueueUserWorkItemCallback.WaitCallback_Context(Object state)
at System.Threading.ExecutionContext.RunInternal(ExecutionContext executionContext, ContextCallback callback, Object state, Boolean preserveSyncCtx)
at System.Threading.ExecutionContext.Run(ExecutionContext executionContext, ContextCallback callback, Object state, Boolean preserveSyncCtx)
at System.Threading.QueueUserWorkItemCallback.System.Threading.IThreadPoolWorkItem.ExecuteWorkItem()
at System.Threading.ThreadPoolWorkQueue.Dispatch()
at System.Threading._ThreadPoolWaitCallback.PerformWaitCallback()
You can now identify when w3wp crashes happen, but what to do now?
Often, the logged exception will give you what you need to know, but sometimes you need some more context (i.e. what were the arguments to a faulting method?) or sometimes the details might be a bit more obscure.
Take, for example, the scenario here in which our customer couldn’t identify the root cause of the crash. It was obvious that there was an unhandled null reference exception in an awaited task, but they had no idea what the task was, or what HTTP request was spawning the task.
If this happens to you, you’re gonna need a crash dump.
Simply put, a crash dump is a snapshot of your application as it was crashing, and immediately before all resources are unloaded and the process is terminated. Depending on the type of crash dump collected, that can contain different data. At the lowest level, you can get the call stack of the thread which had the exception. This is almost always automatically collected into a Windows Error Report.
At a slightly deeper level, you can collect either a minidump or a full user dump. What’s the difference?
A minidump will contain the current call stack across all threads in your application, and a snapshot of what types of objects are in memory.
A full user dump will contain all of that plus a full snapshot of the contents of the objects in memory, which can be very useful for post-mortem analysis in these sticky situations.
To identify the root cause of a w3wp crash, you are going to want a full user dump that includes the full memory snapshot so you can further inspect what occurred.
There are a couple of tools provided by Microsoft to help you collect what you need in these scenarios. The most common is DebugDiag. The tool is easy to download and use, and comes with a rules engine you can set up to collect these dumps when a crash occurs. Depending on how much you already know about the exception, you have some options:
Select the rule type. We want “Crash.”

You’re most likely going to select it for a specific app pool, or all IIS processes.

And finally, all of your options:
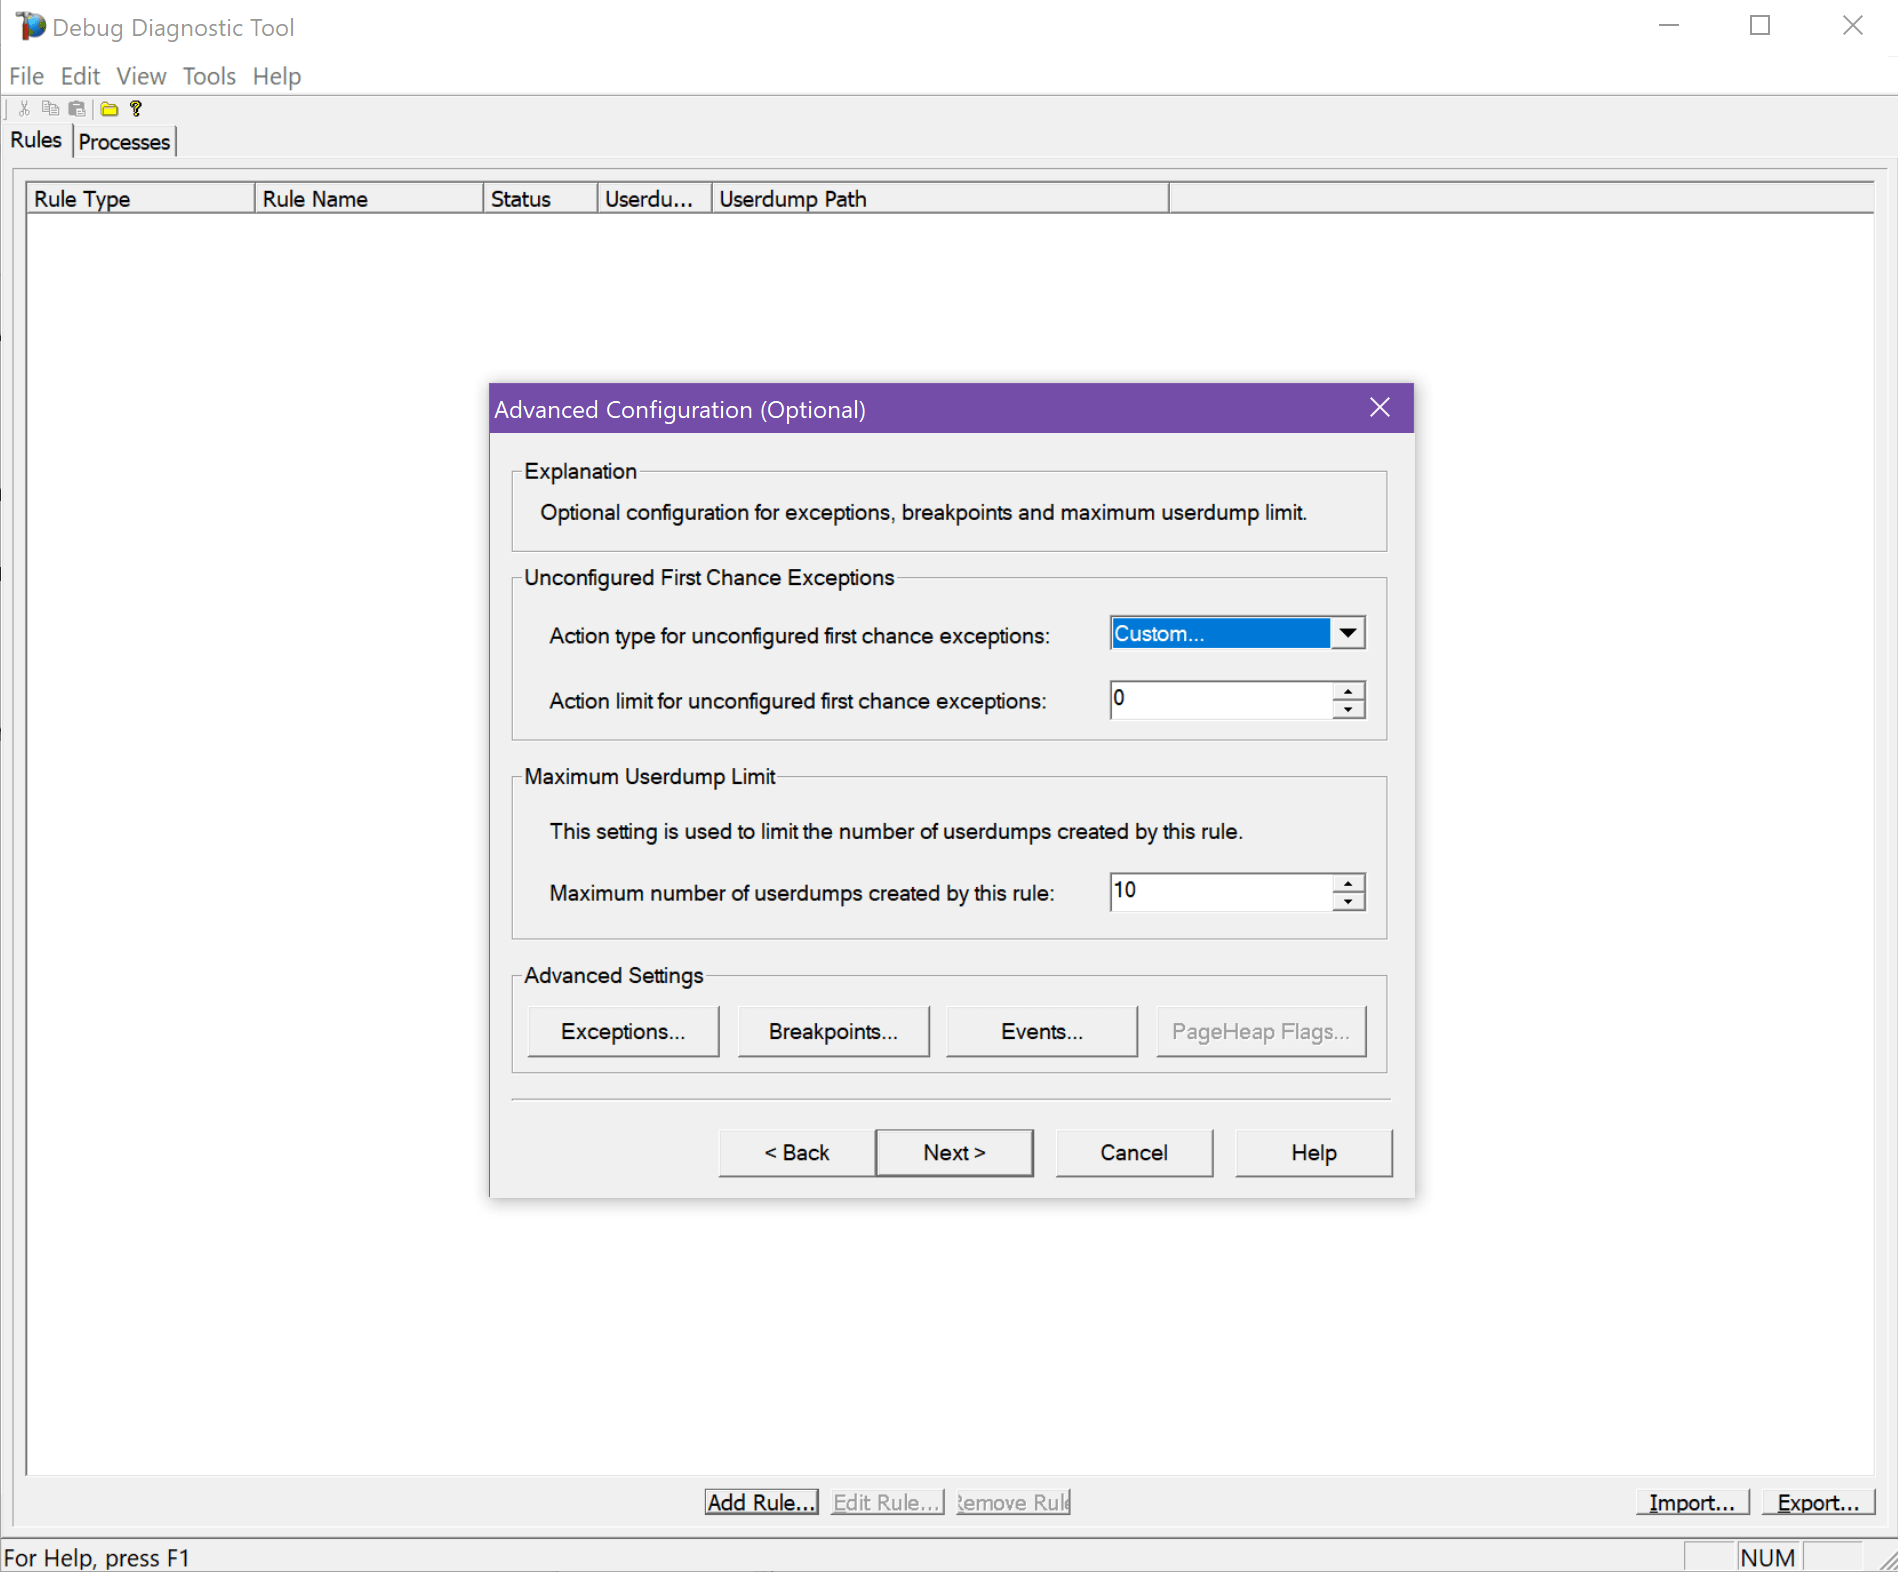
Enable the rule and you’re ready to go!
As part of setting up DebugDiag you have to specify an output folder for the crash dump files. Once a crash dump occurs, just check that folder to find your w3wp crash dump files.
Once you have a crash dump you would like to analyze, there are a couple tools you need to know about. Let’s walk through how to open and inspect a crash dump.
DebugDiag will also analyze the dump file for you, and give some good information about what happened. Just choose the “CrashHangAnalysis.”

You can see that right away it finds our unhandled exception which caused the crash:

And if you jump to that thread, you can see the call stack that generated the error:

But there’s one glaring issue here: I have absolutely no idea what request spawned this error. In my simple example, it would be simple to find. I only have one caller of this method. But let’s say you have a base controller with this method, and hundreds of requests per minute.
How do you know what web request or background code generated this exception?
To help identify the root cause, we really need to know exactly which HTTP request caused the issue. In our case, I can already tell you that will be difficult since the code is simply using a “ThreadPool.QueueUserWorkItem” which is simply going to schedule a method to be fired once a thread becomes available. It doesn’t wait, block, or return to the caller in any way. But there are a couple of ways to hone in on what we are looking for.
DebugDiag can show you all of the HTTP contexts that were active when the crash happened. If you have a busy application, it could be a lot of different URLs. It may not point you in the right direction, but it might help you narrow down where to dig deeper.

If you aren’t sure which web request is the problem, or if you are not sure of the exact cause, you will need to dig deeper into the crash dumps.
This is where the Windows Debugger comes in. Remember when I mentioned that the crash dump (if a full dump) contains all of that great memory snapshot in it? You’re going to need the Windows Debugger to access that, and in addition, WinDbg contains some great analysis tools to hunt down the exception that caused your app to crash.
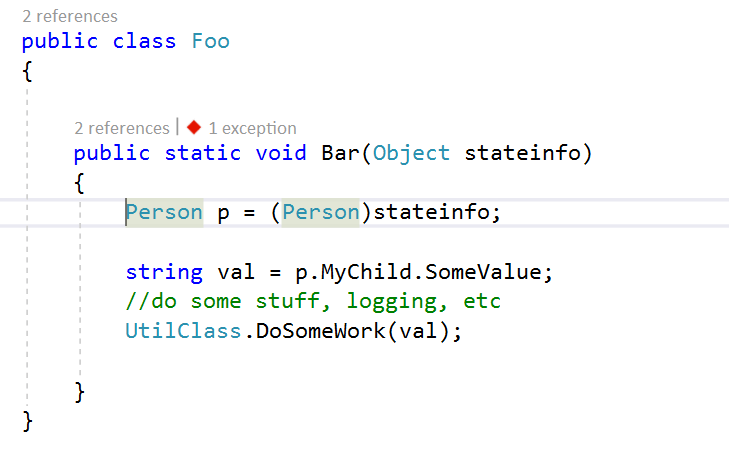
For this example, let’s say that we pass some state object or other contextual data to our callback method. In my case, I’m changing the method to accept an object of type “Person” with a child object of type “Child” and then I’m going to cause a null reference exception at runtime by accessing a property of that object which hasn’t been initialized yet.
To get to the root cause of what is causing the crash, we need to figure out what exact data was passed into our code. To do this, we need to inspect the memory snapshot that was captured in the dump. Inspecting it will allow us to identify the values of the variables in memory.
To start, you need to launch the WinDbg version that matches the bitness (x86 or x64) which your app pool was running in.
Once you have that, let’s open your crash dump file.
In WinDbg, go to File → Open Crash dump and load your dump. You’ll see some text fly by and end up with something like this:

WinDbg can be a little intimidating if you have never used it before. It’s not very intuitive. Take the following steps:

!analyze -v
The analyze command shows details about the exception that occurred when the crash occurred. Running this command points you to the thread that was in use and what the exception was.
Now, you should get an analysis of the dump with a call stack similar to what DebugDiag showed.

Now we want to try and figure out some more context (and specifically, the actual HTTP context!) around the error. Let’s start looking at some memory.
.loadby sos clr
!CLRStack -a
This will give the CLR call stack for the current thread;the prior “analyze” command would have set our session to be on the thread in question.
You’ll see the call stack, with pointers to the arguments passed into the method calls:
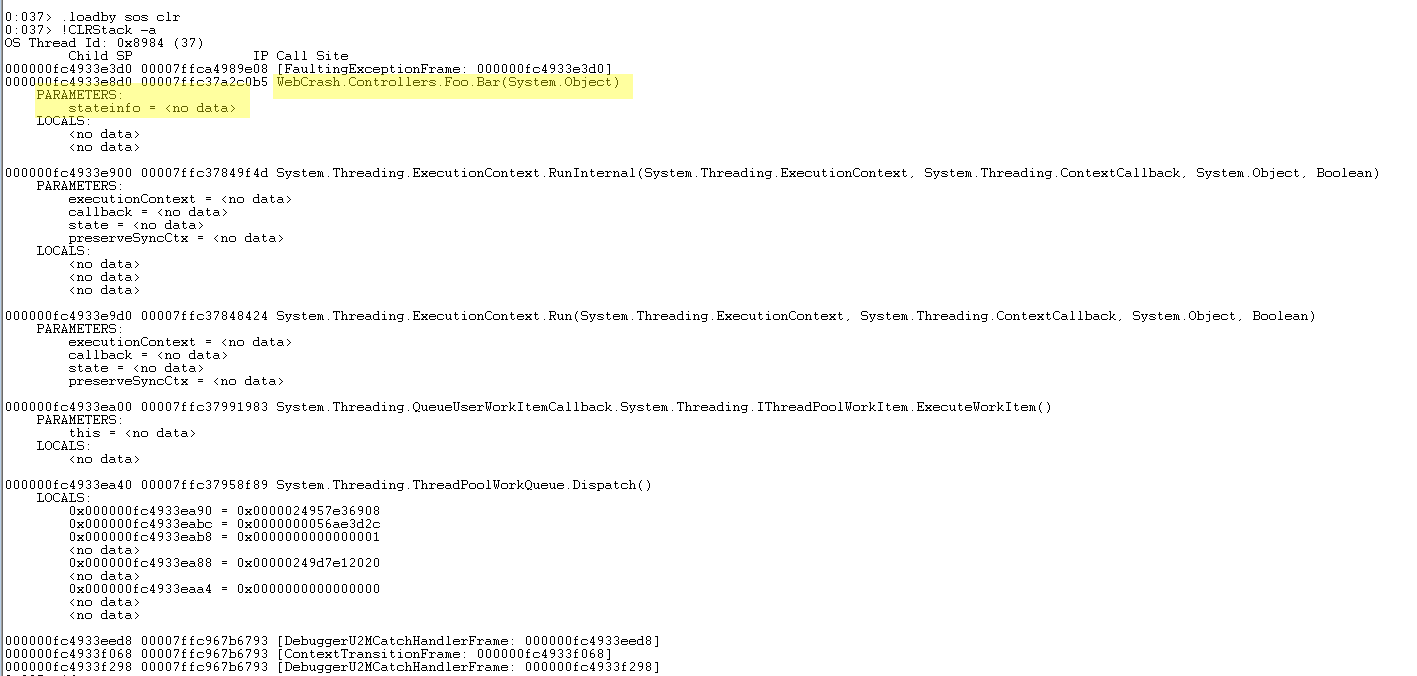
For some reason, it doesn’t show a pointer to our “stateinfo” parameter, but it should still be in memory somewhere. We know from the stack trace what method the crash happened in.
Now we are trying to identify what was in memory at that time that can help identify the root cause, including the HTTP context and data passed into the failing method.
Let’s explore a bit more, shall we?
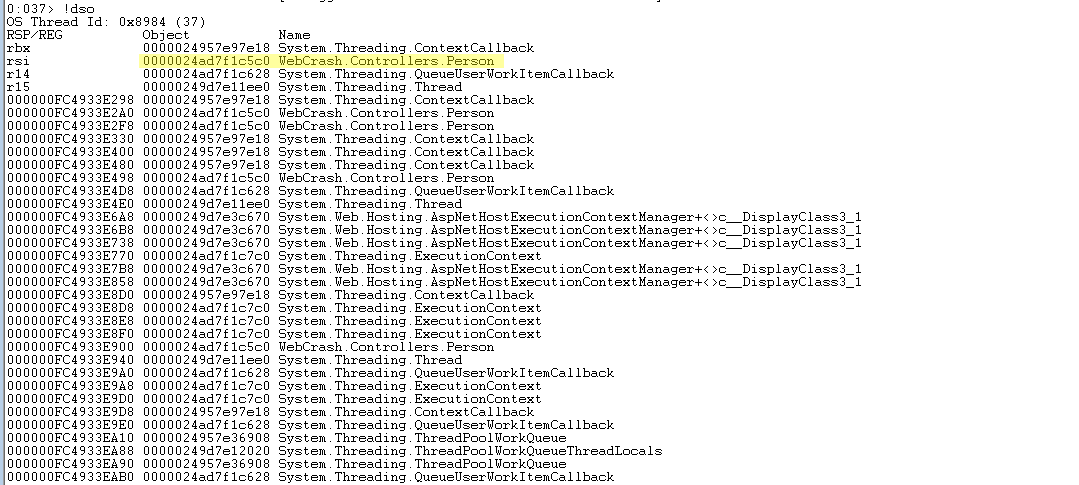
!dso
Which will dump a list of all the CLR objects that are on the stack for the current thread.
In the list below we can see our “WebCrash.Controllers.Person” object is in memory and what the memory address is. You could inspect deeper into any of these objects in memory.
Now, the goal is to look at the data that is in this object in order to get some sort of context about our path that is causing this fatal exception. You can inspect .NET objects, again with a command from the SOS extensions:
!do 0000024ad7f1c5c0
(note, 0000024ad7f1c5c0 is the Object address from the above dump of stack objects)
This shows us the layout of our class, and in it we can see that both “LastName” and “MyChild” are null because the value is all zeros:
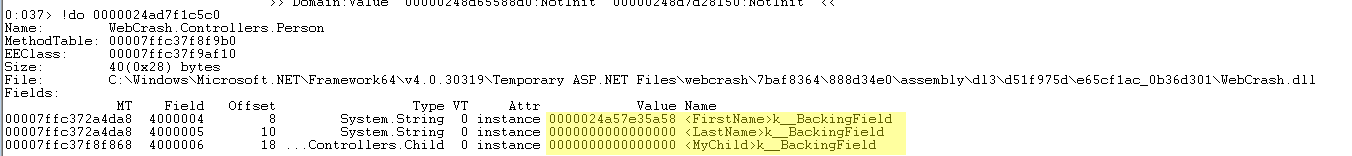
Whereas, “FirstName” does have a value. Take that address and inspect it:
!do 0000024a57e35a58
And here’s our string:
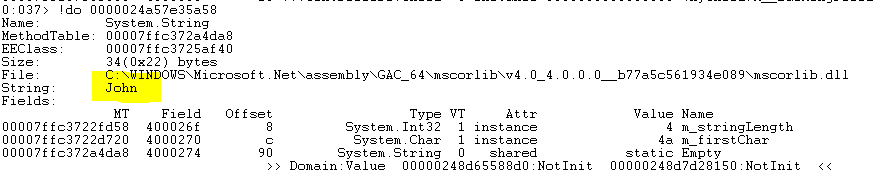
Now that we know what the input value was to the method that threw the exception, we can see how it may have affected logic in the code.
So far we have focused on identifying data in memory that was passed in to our method that could identify the root cause.
If you are trying to identify the URL and other details about the web request that was in memory, you will want to look for and inspect the HTTP context object. For example, it could be an object of type “System.Web.Hosting.IIS7WorkerRequest”.
By inspecting details on that object, you can quickly identify the URL, if it was a GET or a POST, and many other details.
Be sure to check out this other blog post which shows more details about inspecting the HTTP context: Using WinDbg to Analyze .NET Crash Dumps – Async Crash
You can take this line of thought and extrapolate it out a bit and see the power in digging through the memory of objects at crash time to help determine the root cause.
In our example, we forced a crash by using a background thread. For your scenario, you may have an HttpContext available on your stack in your thread, and be able to determine the requested URL, parameters, session, and more.
Remember that it is important to continually improve you .NET applications. Stackify offers two tools that can help you do just that. Stackify Prefix helps you write better code on your local machine and Stackify Retrace is the only full lifecycle application performance management tool. Try either for free.
Related Articles:
Stackify's APM tools are used by thousands of .NET, Java, PHP, Node.js, Python, & Ruby developers all over the world.
Explore Retrace's product features to learn more.
If you would like to be a guest contributor to the Stackify blog please reach out to [email protected]


