Last week, I had an urgent request from a client that we know well. They had an IIS app pool that was experiencing frequent crashes, and they couldn’t figure out why. Even though it fell out of the scope of Retrace, they thought we might be able to help. We love these sort of requests here, because it gives us great insight into the sort of problems our clients are trying to solve.
It all started with some alerts out of Retrace – there was an uptick in errors, and you could see the performance hit the app was taking by the app pools restarting often.
Our client did the right first steps: look for the smoking gun, or a signal in the noise. Certainly there was something telling in the event logs:
System.NullReferenceException : Object reference not set to an instance of an object.
System.Web.ThreadContext.AssociateWithCurrentThread(Boolean)
   System.Web.HttpApplication.OnThreadEnterPrivate(Boolean)
   System.Web.LegacyAspNetSynchronizationContext.CallCallbackPossiblyUnderLock(System.Threading.SendOrPostCallback, System.Object)
   System.Web.LegacyAspNetSynchronizationContext.CallCallback(System.Threading.SendOrPostCallback, System.Object)
   System.Threading.Tasks.AwaitTaskContinuation.RunCallback(System.Threading.ContextCallback, System.Object, System.Threading.Tasks.Task ByRef)
   System.Threading.Tasks.AwaitTaskContinuation+<>c.b__18_0(System.Object)
   System.Threading.ExecutionContext.RunInternal(System.Threading.ExecutionContext, System.Threading.ContextCallback, System.Object, Boolean)
   System.Threading.ExecutionContext.Run(System.Threading.ExecutionContext, System.Threading.ContextCallback, System.Object, Boolean)
   System.Threading.QueueUserWorkItemCallback.System.Threading.IThreadPoolWorkItem.ExecuteWorkItem()
   System.Threading.ThreadPoolWorkQueue.Dispatch()
It was pretty obvious from looking at this exception, and the fact that it killed their process, that we were seeing an issue known in using async patterns in .Net 4.5. If you don’t properly wait on your task, it throws a null reference on completion. It’s unhandled, and kills the process.
In fact, there is a great thread on Stack Overflow describing a similar problem.
The problem, however, is they have a large code base and they weren’t exactly sure where this problem was occurring. The error was thrown on a thread with a pretty short call stack that was basically just to handle the task completion.
The next step that the client took was in the right direction: get a crash dump using DebugDiag2.
If you’ve never used it, it is a great tool. Set up a crash rule, and when IIS encounters an exception that kills the process, it grabs a memory dump and runs some analysis rules to try and find what happened (among other things, such as memory leak detection).
Unfortunately, the report that came out simply told them what they already knew. A null reference exception was thrown on a certain thread and shut down the app. They thought they had hit the end of the debugging road.
But, that crash dump has a lot more value to it. Enter WinDbg.
A lot of .NET developers believe that WinDbg is not for them. But that would be wrong. It is an extremely powerful debugger that I use nearly every day. The Visual Studio debugger is great for stepping through a .Net application, but the Windows Debugger has the ability to analyze memory dumps, and break into an application and debug everything (managed or unmanaged) on any thread in the app.
Windows Debugger has two flavors: x86 and x64. You will want to launch the one that corresponds to your app’s bitness.
Once, launched, open the crash dump from File → Open Crash Dump
You’ll notice that the debugger already is telling us something interesting:
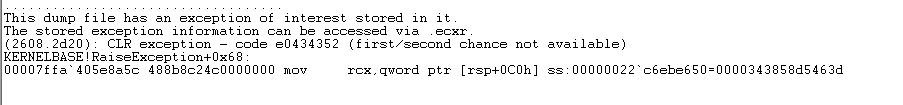
I don’t have my client’s debug symbols, but that certainly helps. At a minimum, we need publicly available symbols for the .NET framework
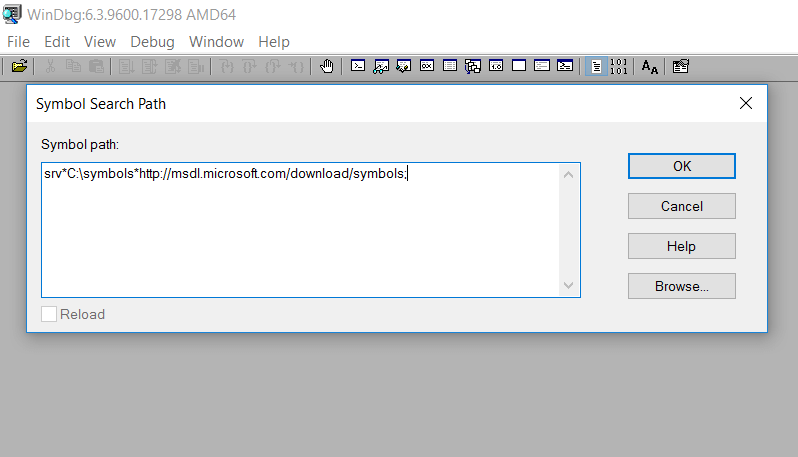
File→ Symbol Search Path
Provide a symbol folder (in my case C:\symbols) and the public server, i.e:
srv*C:\symbols*http://msdl.microsoft.com/download/symbols;
Be sure to check “Reload” and then OK.
In order to view any .Net objects in WinDbg, you have to load the SOS extension.
In the WinDbg command line, input:
.loadby sos clr
Next, let’s run an analysis on the dump:
!analyze -v
Now, we get a lot of output:
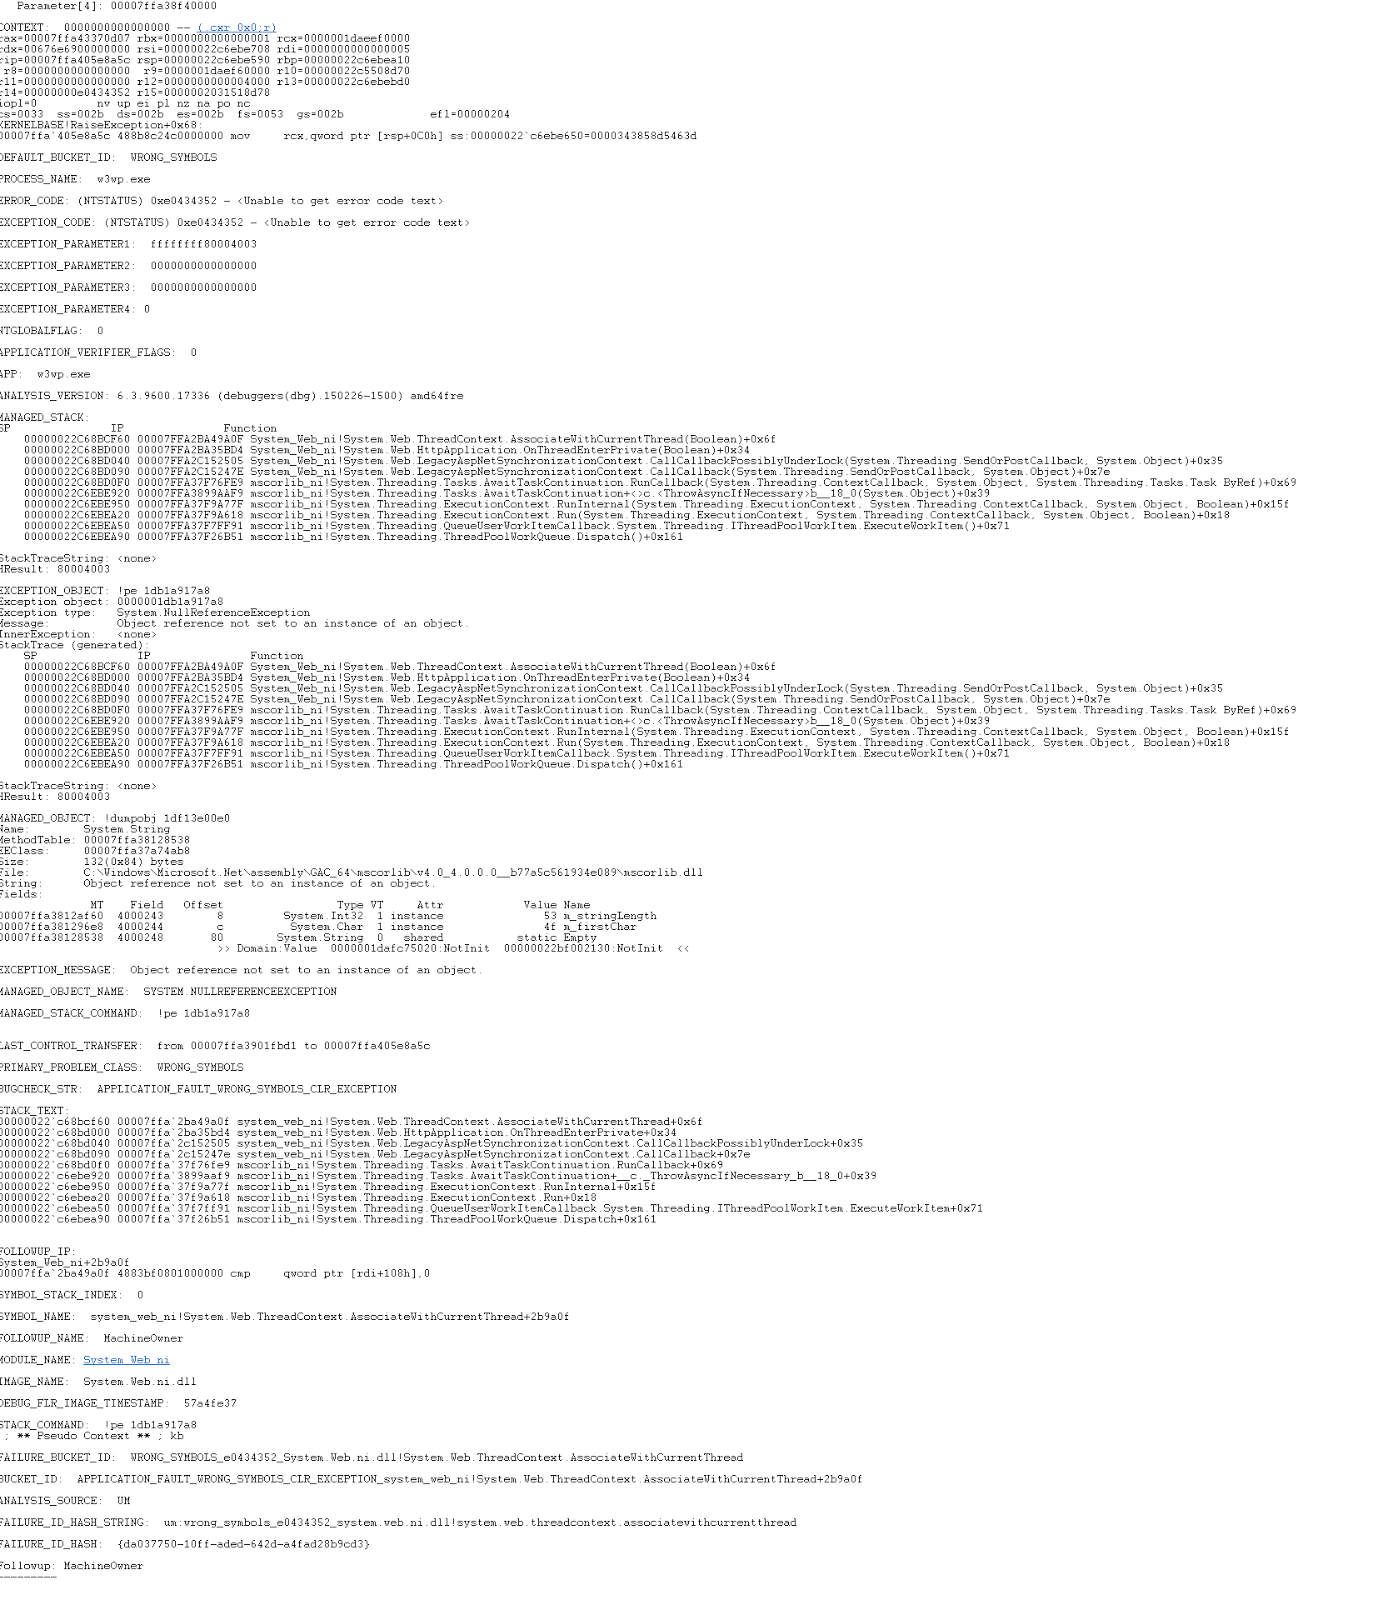
Basically, the report is telling us what we already know from our previous DebugDiag analysis. But, it puts us on the thread that had the issue, so let’s play with some more SOS commands and try to figure out what happened.
Run:
!CLRStack -a
And that gives us the callstack on the thread, but again it’s the same as we already know. But there is another command at our disposal which is awesome:
!dumpstackobjects
OR
!dso
Will give us the ObjectIDs of any .Net objects that are on the current thread. My hunch is that this thread supporting the async task has some sort of state which will help us know what request generated the task.
0:069> !dumpstackobjects
OS Thread Id: 0x2d20 (69)
RSP/REG          Object           Name
r15              0000002031518d78 System.Threading.Thread
00000022C6EBE680 0000001db1a917a8 System.NullReferenceException
00000022C6EBE6A0 0000001db1a917a8 System.NullReferenceException
00000022C6EBE6F8 0000001db1a917a8 System.NullReferenceException
00000022C6EBE740 0000001db1a91c40 System.Threading.QueueUserWorkItemCallback
00000022C6EBE758 0000001db1a91ad0 System.Runtime.ExceptionServices.ExceptionDispatchInfo
00000022C6EBE760 0000001db1a917a8 System.NullReferenceException
00000022C6EBE780 0000002031518d78 System.Threading.Thread
00000022C6EBE788 0000001db1a91c40 System.Threading.QueueUserWorkItemCallback
00000022C6EBE790 0000001db1a917a8 System.NullReferenceException
00000022C6EBE7A8 0000001df1b95078 System.SByte[]
00000022C6EBE7B0 0000001df1392cc0 System.Threading.ContextCallback
00000022C6EBE7C0 0000001db1a917a8 System.NullReferenceException
00000022C6EBE880 0000001db1a91ad0 System.Runtime.ExceptionServices.ExceptionDispatchInfo
00000022C6EBE888 0000001db1a917a8 System.NullReferenceException
00000022C6EBE8A8 0000001db1a91c40 System.Threading.QueueUserWorkItemCallback
00000022C6EBE8B0 0000002031518d78 System.Threading.Thread
00000022C6EBE910 0000001df1392cc0 System.Threading.ContextCallback
00000022C6EBE920 0000001db1a917a8 System.NullReferenceException
00000022C6EBE928 0000001db1a91ad0 System.Runtime.ExceptionServices.ExceptionDispatchInfo
00000022C6EBE938 0000001db1a91cc8 System.Threading.ExecutionContext
00000022C6EBE940 0000001db1a91cc8 System.Threading.ExecutionContext
00000022C6EBE950 0000001df1392cc0 System.Threading.ContextCallback
00000022C6EBE990 0000002031518d78 System.Threading.Thread
00000022C6EBE9F0 0000001db1a91c40 System.Threading.QueueUserWorkItemCallback
00000022C6EBE9F8 0000001db1a91cc8 System.Threading.ExecutionContext
00000022C6EBEA60 0000001df1392c98 System.Threading.ThreadPoolWorkQueue
00000022C6EBEAB8 0000001fb114f2e8 System.Threading.TimerQueue
00000022C6EBEAD8 00000020314c0ae8 System.Threading.ThreadPoolWorkQueueThreadLocals
00000022C6EBEAE0 0000001df1392c98 System.Threading.ThreadPoolWorkQueue
00000022C6EBEB00 0000001db1a91c40 System.Threading.QueueUserWorkItemCallback
00000022C6EBEE18 0000001df19f8320 System.Web.Hosting.IIS7WorkerRequest
Now, there are a lot of interesting objects here, especially if you want to get into the bowels of threading. But, look at that last object: System.Web.Hosting.IIS7WorkerRequest. Let’s check it out.
I use the !DumpObject command and voila:
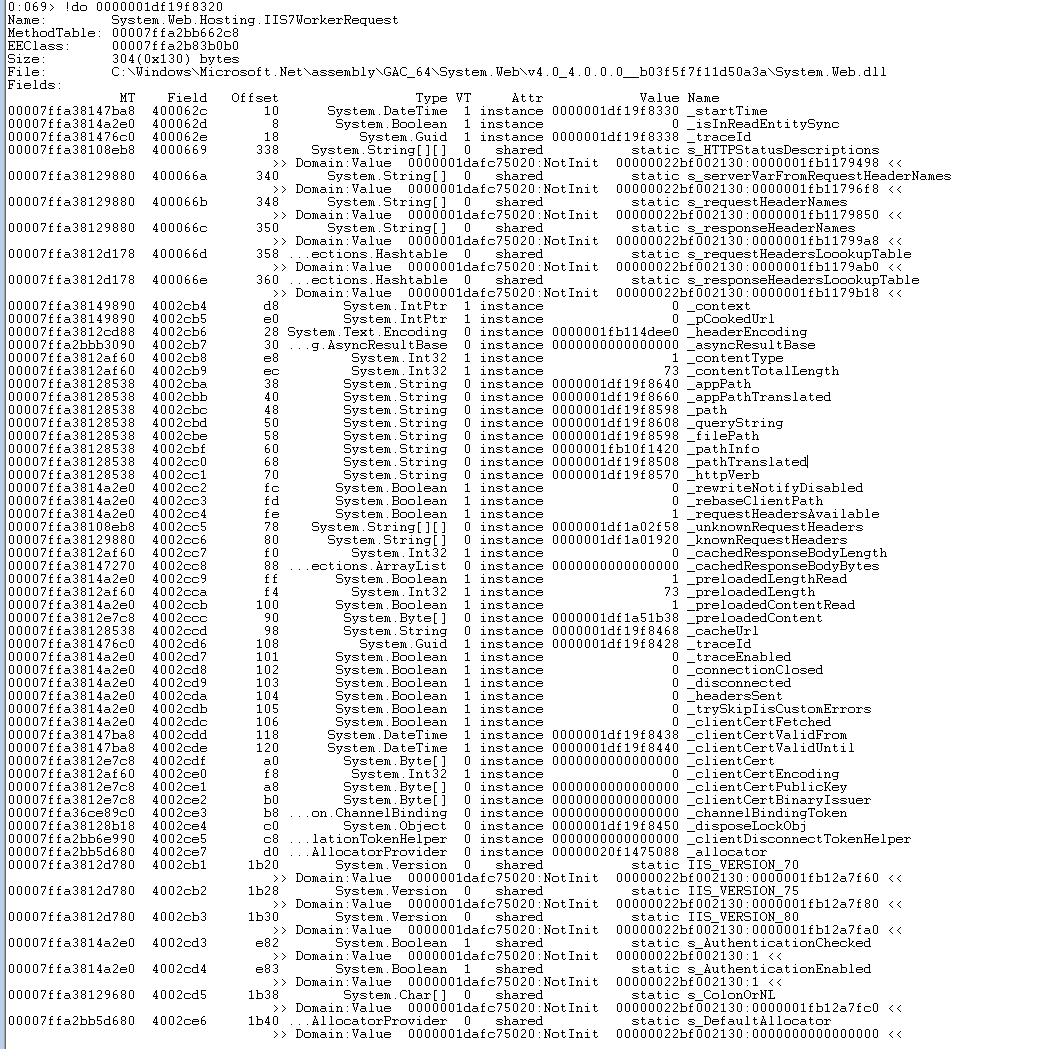
See a couple interesting fields there? _path and _httpVerb. Continuing with my !dumpobject command, I can see:
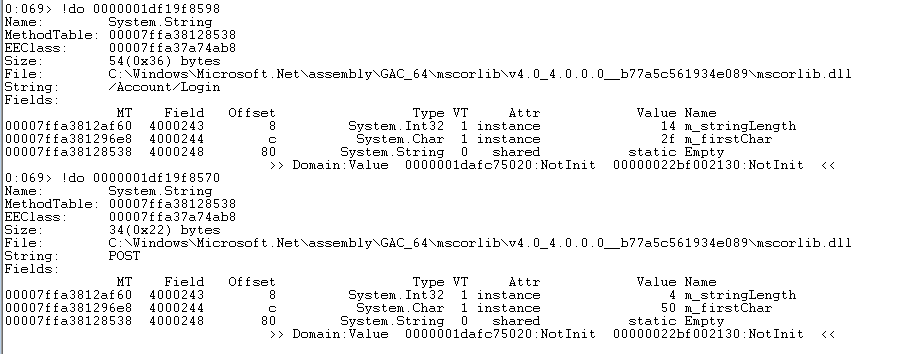

It would appear to me that this thread originated from a request to /Account/Login and it was a POST.
I reached back out to my client and told them that this is where I would start looking. Within a few minutes I got an email back that said that certainly was the issue. They were calling a method from a 3rd party library that they did not realize needed to be waited – and could easily reproduce this issue. Further, they said: “I’d be debugging the diff between those two git hashes all day without that clue.”
All this to say: while WinDbg seems like a steep learning curve (it is, and I will write more about it soon) it’s extremely powerful for digging in deep and solving really tough problems. This example is just the tip of the iceberg!
Stackify's APM tools are used by thousands of .NET, Java, PHP, Node.js, Python, & Ruby developers all over the world.
Explore Retrace's product features to learn more.
If you would like to be a guest contributor to the Stackify blog please reach out to [email protected]