VisualVM is a Java profiler, one of the several types of Java performance tools (to see more of our favorite Java performance tools, check out this post). In today’s post, we’ll take a look at VisualVM, how it works, and some integrations and alternatives.
VisualVM is a powerful tool that provides a visual interface to see deep and detailed information about local and remote Java applications while they are running on a Java Virtual Machine (JVM). It utilizes and integrates some of the command-line tools that JDK provides and bundles them up to see the application within JVM; this bundle includes command-line tools jmap, jstack, jConsolem, jstat, and jinfo. All these tools are available in standard JDK distribution.
It helps the programmers and architects to track memory leaks, analyze the heap data, monitor the garbage collector and CPU profiling. It also helps to improve the application performance and ensure that memory usage is optimized. With features like thread analysis and head dump analysis, it is very handy in solving run-time problems.
VisualVM is free, and you don’t need to pay a separate cost to get this.
Official Page: https://visualvm.github.io
The good news here, you actually don’t need to do anything, it is already available in the JDK bin directory. It’s available after JDK 1.6 update 7. Once you are in the bin directory of JDK, you will find jVisualVM.exe; just click on it, and the application starts up.

You can see all the running Java applications on the left pane of the interface.
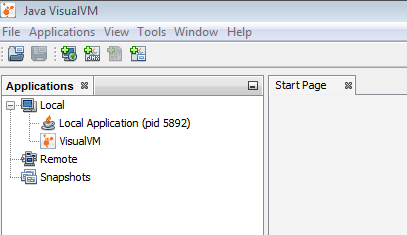
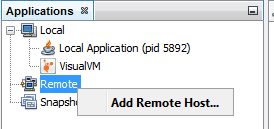
The on top-left you can see application tab, and under this, you can see different options like Local, Remote and Snapshots. To set a remote application profiling, you must connect to the remote server and add that application:
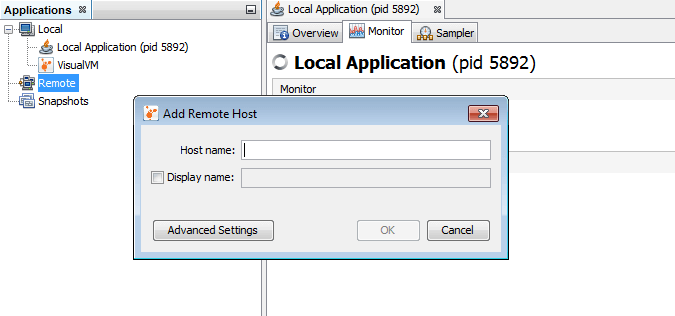
While setting up the remote application, you can give it name as well, “Display name:.”
There are many important features that VisualVM supports, such as:
So if you see the above list, you can actually monitor your applications — both local and remote — which is quite handy in case of a run time exception, like outOfMemoryException, deadlocks, race conditions, etc., as you get to visually see which objects are causing an outOfMemoryException, for example, or the objects/resources causing thread deadlock.
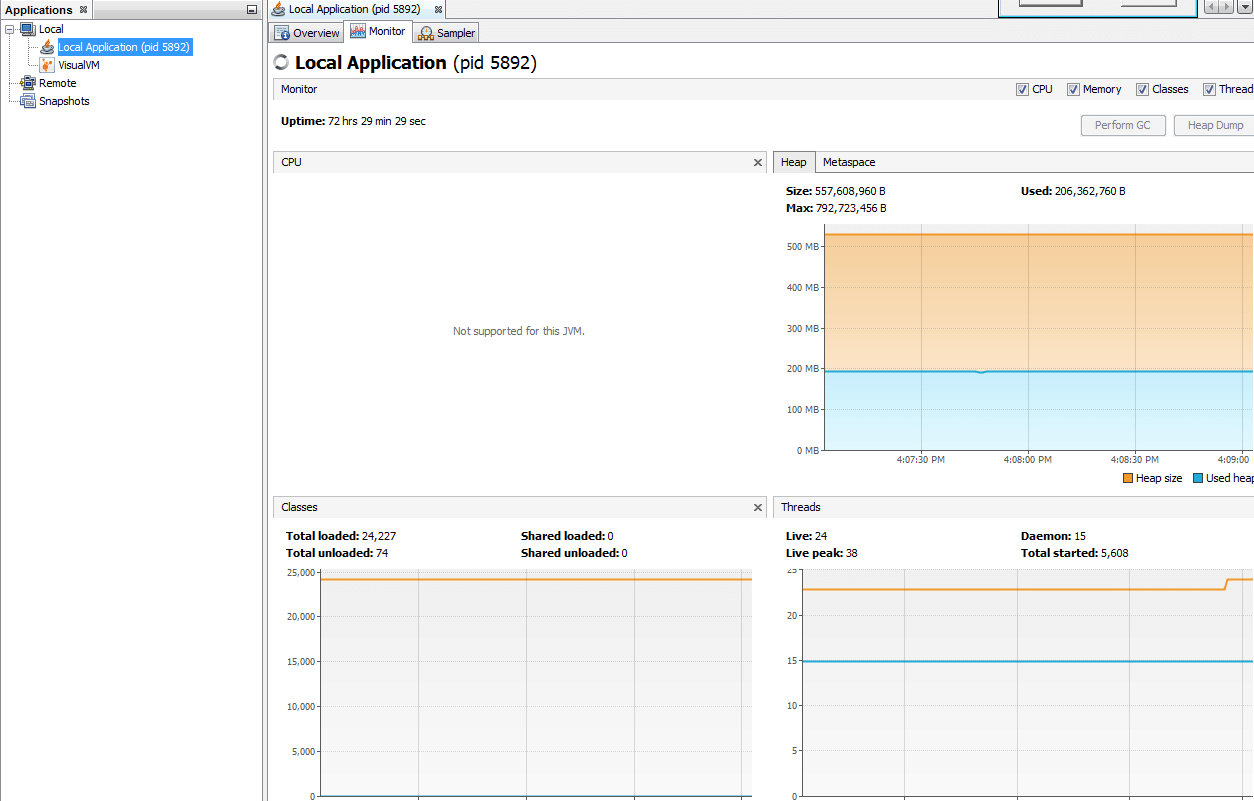
Once the VisualVM application starts, you will see the list of applications on the left pane, and on the right side of the pane you will see different tabs. The important tab here is the “Monitor” tab. It gives you a detailed analysis of heap space and utilization, classes and threads. It can read and interpret binary heap dump files. You can either generate a heap dump, or you can read one you have generated outside this application (e.g. a dump created using kill-3 command on Unix/Linux server where the application is hosted).
The VisualVM-MBeans plugin will give programmers a MBean Browser to help you access the all of the platform MXBean instruments. You can monitor and manage the MBeans of the application. Similarly, the VisualVM-GC plugin will provide a graphical interface for the information regarding garbage collection.
The purpose of CPU profiler is to determine how much time the CPU is spending when it executes the program and using this information; you can optimize the code and improve the overall performance of the application.
Here’s an interesting article about monitoring the IBM JVM with VisualVM.
In cases where the interface doesn’t look interesting, you can integrate to different development IDEs like Eclipse, IntelliJ, NetBeans via the plugin provided. It makes life easier for developers. Here are a few useful links for setting them up in IDEs:
With application performance and memory utilization becoming so important these days, it obvious that profiling tools are in demand. There are many tools which are serving similar purpose that VisualVM is service. There are a few other profiling tools available in the market:
In summary, VisualVM is a valuable tool which can provide the programmer and coder and deep details of application is performing in terms of CPU, memory and threads and then how can they utilize these in formations to improve the performance and scalability of their applications. It is also very useful in supporting applications and solving complex run-time problems.
For further reading, tutorials, and other helpful insights, visit the following resources:
Stackify's APM tools are used by thousands of .NET, Java, PHP, Node.js, Python, & Ruby developers all over the world.
Explore Retrace's product features to learn more.
If you would like to be a guest contributor to the Stackify blog please reach out to [email protected]


