Complete .NET Monitoring in One Tool

Monitor everything about your .NET and .NET Core applications with one tool

ASP.NET + Windows Services

In depth performance monitoring for ASP.NET & Windows Services. Including MVC, Web API, WCF & WebForms.

.NET Core Support

Full support for the new Core CLR (including 3.0) and full .NET Framework apps running on Windows or Linux.

Support for async/await

Retrace is the only solution on the market with full support for asynchronous .NET applications.

Got Containers?

Monitor your containerized applications quickly and easily

Write shiny(er) .NET web applications.

Stackify’s powerful code profiling is the heart of Retrace and Prefix. Our goal is to make it easy for to improve your code’s performance.

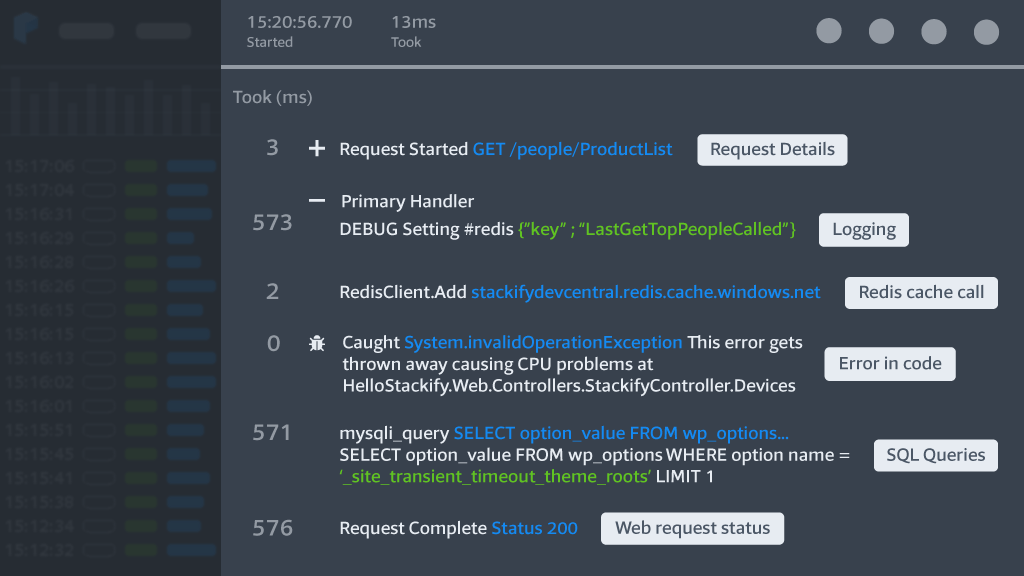
Prefix is the world’s best dynamic code analysis tool. Prefix also happens to be the world’s only dynamic code analysis tool, but whatevs. Think of it like a lightweight web request profiler built to help developers never say things like “well, it worked on my machine,” ever again.

Prefix’s dynamic code analysis reduces dreaded code churn by validating the behavior of your code with detailed code-level traces, logs by request, hidden exceptions, and SQL query monitoring.

How Retrace for .NET Works

Retrace uses lightweight .NET CLR profiling to automatically track key methods in your code. Detailed performance data helps you understand how your code is performing and how to improve it.

  • Low application overhead
  • Safe for production usage
  • SaaS-based solution

Our monitoring agent is installed on each of your servers or containers. Please review our docs to learn more.

.NET Performance Monitoring

Quickly identify which part of your application stack is the bottleneck and which web requests are being affected.

  • Slow application dependencies
  • Slow SQL queries
  • Slow web requests
  • Top application errors

Retrace Your Code with Lightweight Code Profiling

Retrace uses lightweight profiling to capture critical details about what your code is doing. Get deep, code-level insights into your application’s health. We call it Retrace because you can literally retrace what your code is doing!

  • Key methods in common libraries
  • SQL queries
  • External HTTP calls
  • Exceptions
  • Log messages
  • … and much more

Automatic Instrumentation for Your .NET Stack

Retrace automatically instruments dozens of common .NET frameworks and application dependencies.

Designed for the Cloud

Retrace is designed to work well with cloud based workloads that automatically scale up and down. Multiple cloud deployment options are supported.

Retrace also works with any physical server or virtual machine.

View Your .NET Logs from Anywhere

Sending your logs to Retrace is easy with log4net, NLog, Serilog or our nuget package.

  • Integrated error & web request profiling traces
  • Support for log tags & structured logging
  • IIS logs
  • Log monitoring

Find Every Exception in Your Code

Quickly find exceptions in your code before your customers do. Our .NET CLR profiler can even collect all first chance exceptions thrown in your code.

Sending your logs is easy via log4net, NLog, Serilog or our nuget package.

  • Get alerted about new and regressed errors
  • View related logging to an exception
  • Identify unique exceptions
  • Monitor exception rates

Metrics & Performance Counters

Monitor everything about your servers and applications in one place. Retrace includes powerful monitoring capabilities.

Retrace automatically monitors several important Windows Performance Counters.

  • Charting, alerts, & notifications
  • Server monitoring
  • Windows performance counters
  • Custom application metrics via Stackify SDKs
  • Error rates

Don't Get Left in the Dark

Get Started with Retrace Today.