Streamline troubleshooting and issue resolution with aggregated application and server logs, plus enhanced search and drill down capabilities.
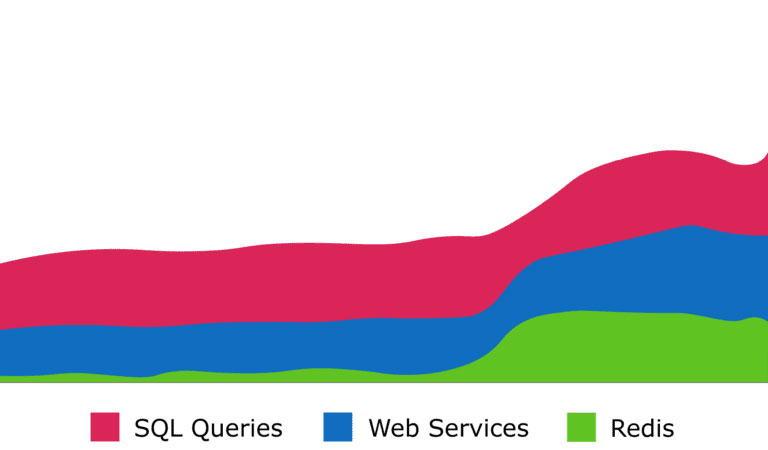
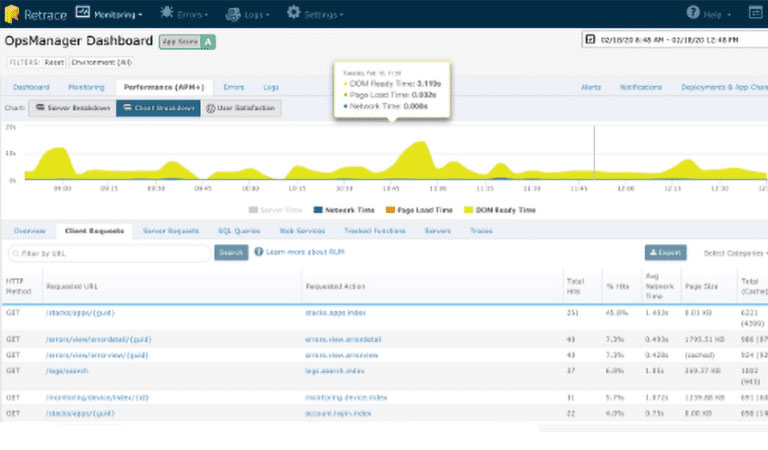
- Consolidate web requests, SQL queries and HTTP calls across all logs
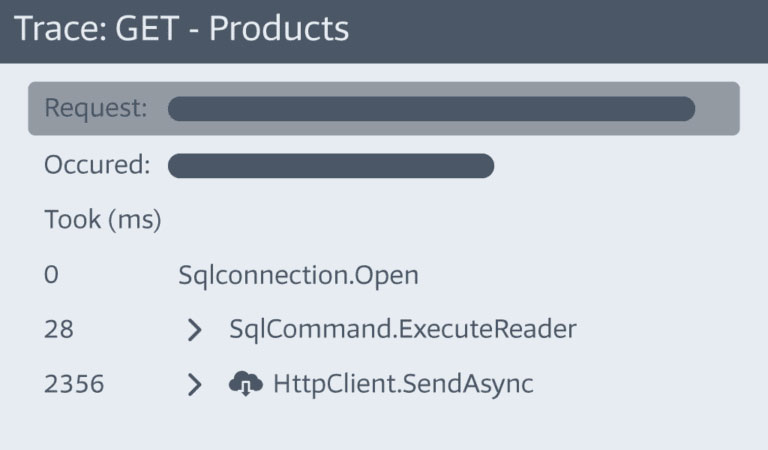
- Go from a log statement to a full transaction trace
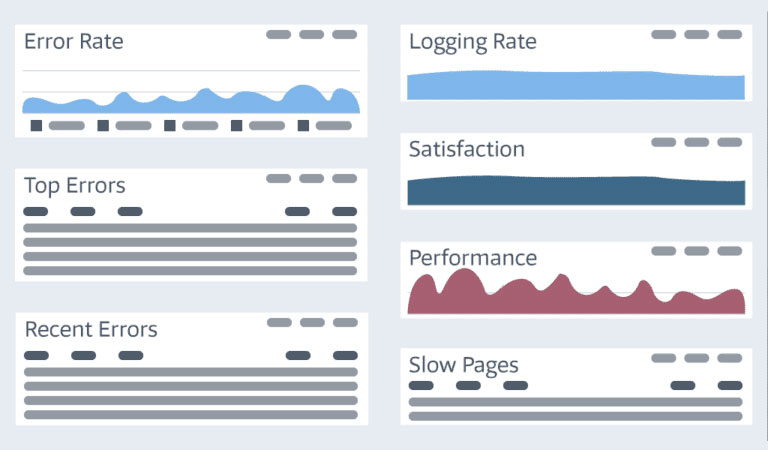
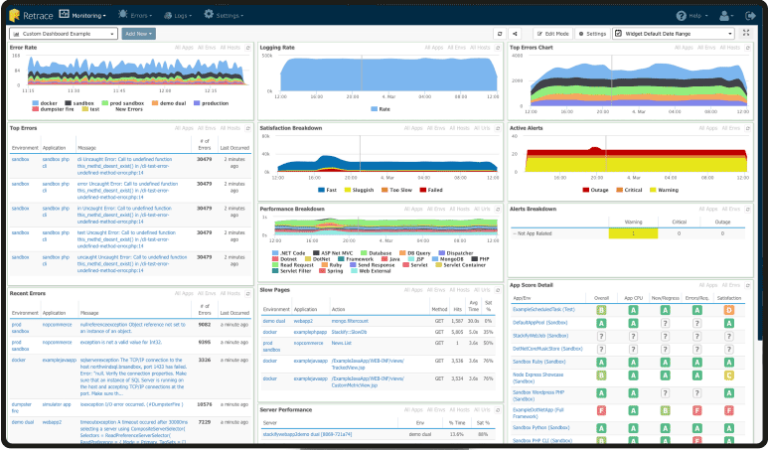
- View, search and drill-down all app and server logs
- Analyze more efficiently with log tags and structured logging
- Configure and monitor customized log queries