Real User Monitoring for Real User Satisfaction
Optimize your application experience leveraging frontend performance insights from the perspective of real users. Retrace real user monitoring (RUM) provides a unified view of each users’ overall experience, correlating client-side traces with errors, logs and server-side metrics.

End-to-End Monitoring
Simplify how you optimize application performance from the code level to the network edge

Reduced Time To Resolution
Accelerate how you locate and resolve bottlenecks for every app request and response

Improved User Experience
Deliver a more intuitive and engaging experience with comprehensive insights into each user interaction
Accelerate Web Performance
One transaction, both sides of the story
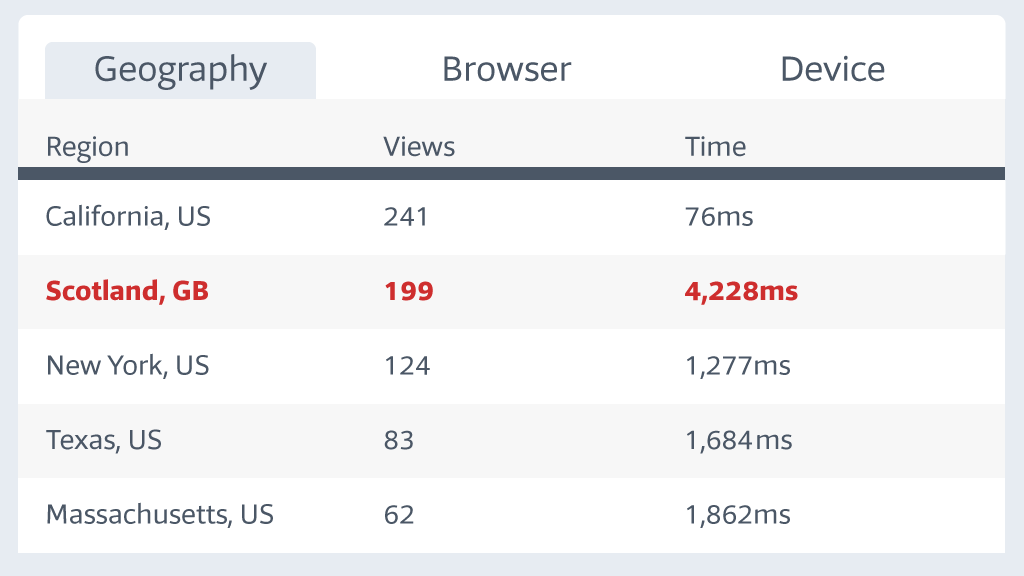
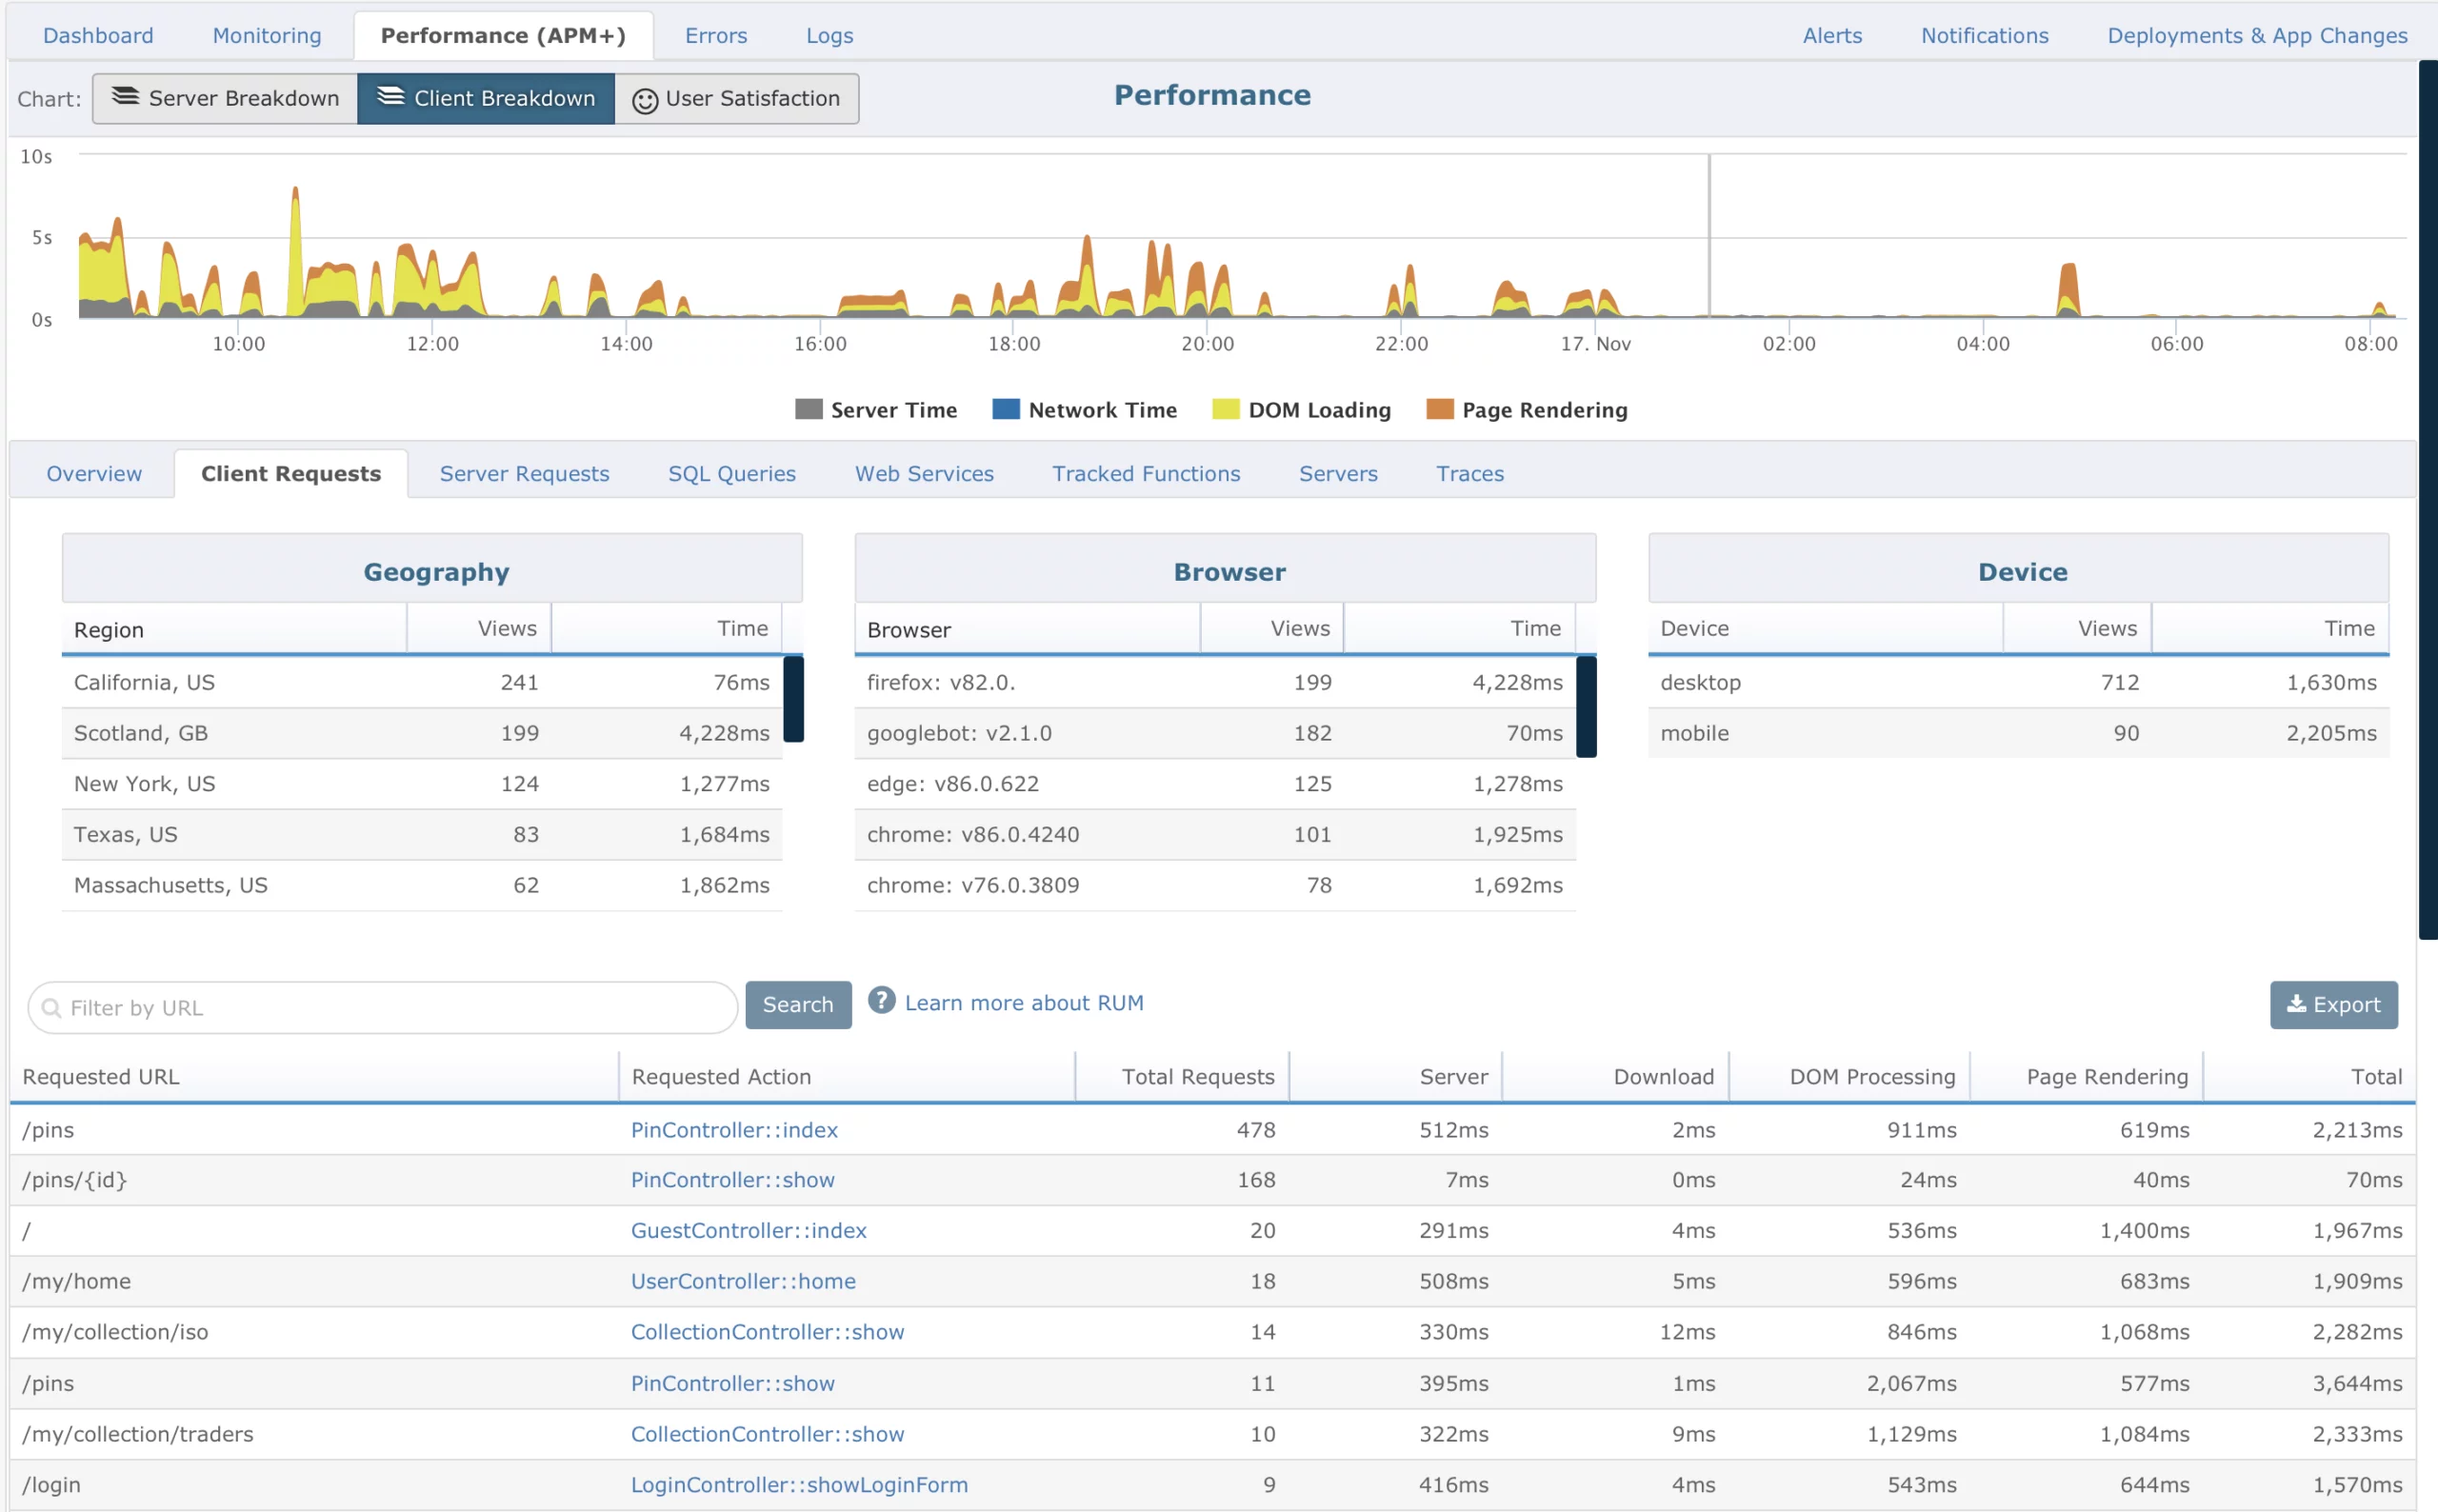
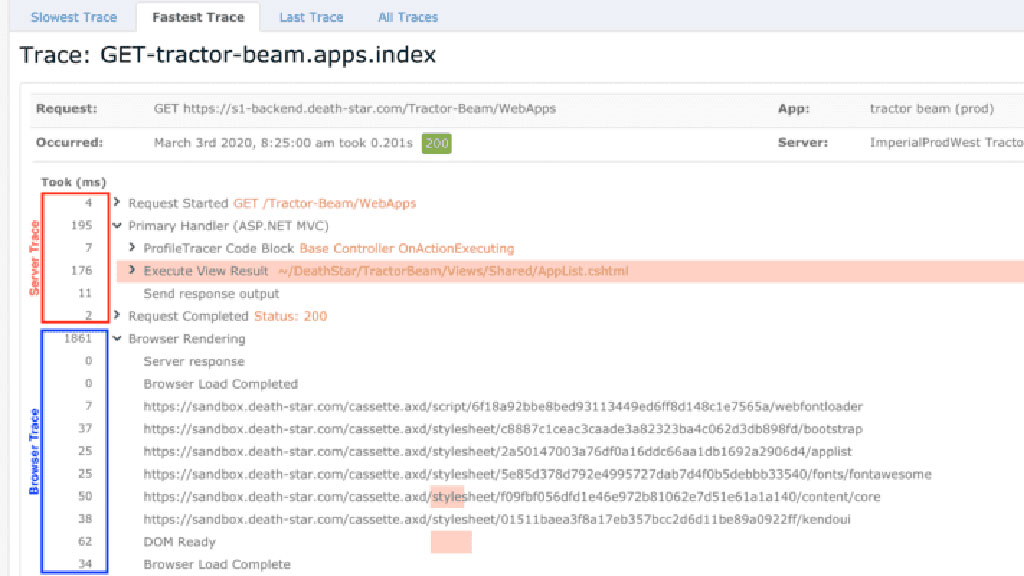
Quickly recognize the nuances and hidden complexities in performance optimization. Retrace RUM merges client-side traces with their server-side counterparts, revealing real-time metrics on every request and response from your websites and applications. When your IT team has the full story on performance, you’ll be confident all your online services are delivering a consistently great user experience.
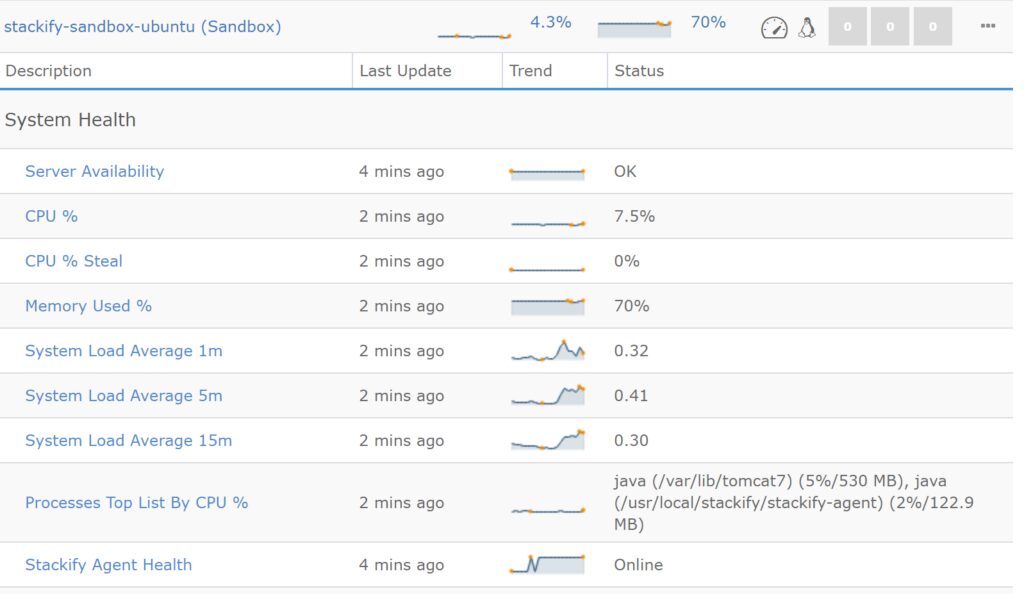
- Bridge the gap between frontend and backend development teams with full-stack, unified monitoring in a single tool
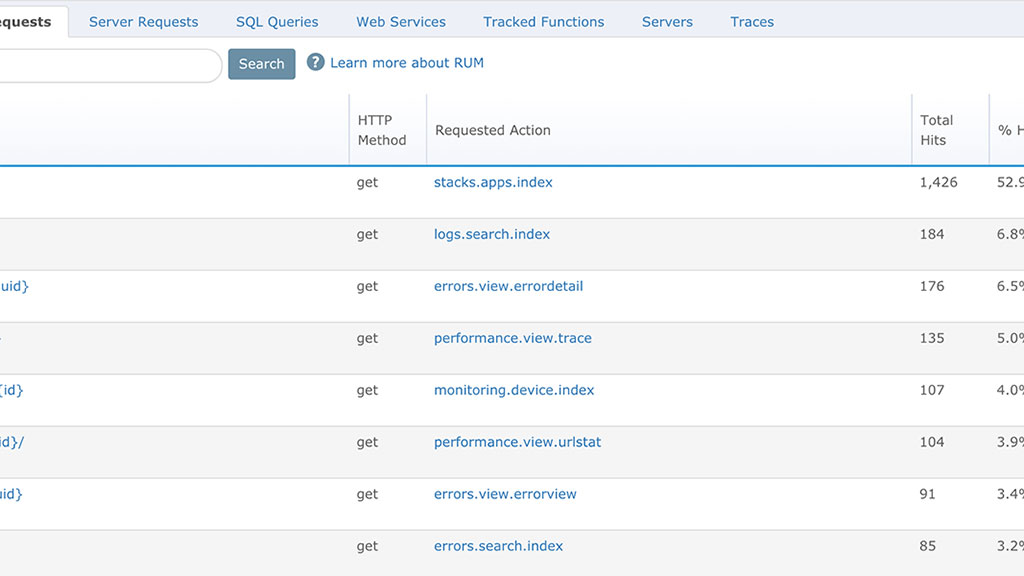
- Improve troubleshooting with detailed context by easily hopping from RUM metrics to detailed traces and logs when investigating issues
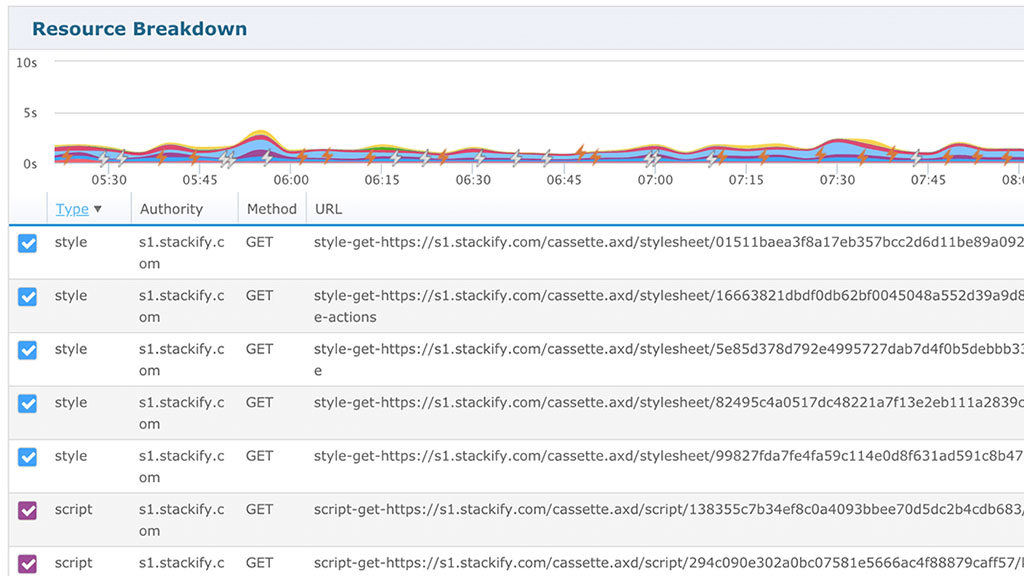
- Easily see how server time and client time combine to show the complete timing of every transaction
A more engaging user experience
As web apps are optimized, pages respond quicker, feel more interactive and deliver a more intuitive experience. Maintaining peak performance keeps users engaged and improves satisfaction, leading to an increase in return visits, longer time spent on your website and higher conversions rates.
- Optimize the user experience by defining user segments based on browser, device or region and correlating to resources used, errors thrown and user actions
- Ensure smooth customer interactions by quickly identifying the root cause of slow load times, whether issues are with the code or the network
- Speed MTTR for slow page load times, system problems, web navigation errors and other malfunctions with analysis of different pages, objects and visits
Performance optimization with a boost
Resource breakdowns quickly identify where and how to boost performance. Whether images need to be optimized or stylesheets and scripts need to be minified or cached, Retrace RUM points you in the right direction and provides actionable insights.
- Optimize business-critical application performance with graphs and charts that visualize the customer engagement and provide drill-down capabilities
- Easily capture code-level insights for improving frontend resource performance
- Quickly pivot from RUM data to request traces and logs for greater context to the issues you’re troubleshooting
Segmentation for deeper insights
Data segmentation provides deeper insights on monitored load times, making it easy to identify opportunities for improving the overall user experience by pinpointing optimal locations for CDNs.
- Capture RUM analytics on usage across mobile and web applications by geography, browser and device type
- Simplify root cause analysis with a single, segmented view of key performance metrics that pinpoint exactly how and where to improve the user experience
- Quickly identify and resolve which segments of customers are experiencing issues with real-time, root cause analysis across geographies, browser types, devices and more
RUM and APM Under One Roof
The more you know about your applications, the better the user experience
Data Capture with details on page requests, JSON and other resourcesSessionization of user visits with data on pages, components and timing information for each visitProblem Detection for any unusual behaviors with analysis of different pages, objects and visitsVisit Reporting with summary data on individual visits and displays of exactly what the user sawReporting and Segmentation identifying page availability and performance metrics across different browsers and user segmentsComprehensive Alerting whenever a serious issue is uncovered

14 day free trial – No credit card required