• Product

      Retrace

      • Full Lifecycle APM
      Menu
      • Full Lifecycle APM

      Prefix

      • Real-time Code Profiling
      Menu
      • Real-time Code Profiling

      Netreo

      • IT Infrastructure Monitoring
      Menu
      • IT Infrastructure Monitoring

      Retrace

      • Full Lifecycle APM
      Menu
      • Full Lifecycle APM

      Prefix

      • Real-time Code Profiling
      Menu
      • Real-time Code Profiling

      Netreo

      • IT Infrastructure Monitoring
      Menu
      • IT Infrastructure Monitoring
  • Pricing
  • Solutions

      By Initiative

      • Application Performance Monitoring
      • Centralized Logging
      • Full Transaction Tracing
      • Error Tracking
      • Application & Server Monitoring
      • Real User Monitoring
      • Deployment Tracking
      Menu
      • Application Performance Monitoring
      • Centralized Logging
      • Full Transaction Tracing
      • Error Tracking
      • Application & Server Monitoring
      • Real User Monitoring
      • Deployment Tracking

      By Role

      • For Developers
      • For DevOps
      Menu
      • For Developers
      • For DevOps

      By Technology

      • Azure Monitoring
      • AWS Monitoring
      • Compatibility
      Menu
      • Azure Monitoring
      • AWS Monitoring
      • Compatibility

      By Language

      • .NET
      • Java
      • PHP
      • Node.js
      • Ruby
      • Python
      Menu
      • .NET
      • Java
      • PHP
      • Node.js
      • Ruby
      • Python
  • Learn
      Resources
      • Blog
      • eBooks
      • Case Studies
      • Webinars
      • ROI Calculator
      • News
      Menu
      • Blog
      • eBooks
      • Case Studies
      • Webinars
      • ROI Calculator
      • News
      Technical
      • Documentation
      • Support
      Menu
      • Documentation
      • Support
  • Login
Start Free Trial
  • Product

      Retrace

      • Full Lifecycle APM
      Menu
      • Full Lifecycle APM

      Prefix

      • Real-time Code Profiling
      Menu
      • Real-time Code Profiling

      Netreo

      • IT Infrastructure Monitoring
      Menu
      • IT Infrastructure Monitoring

      Retrace

      • Full Lifecycle APM
      Menu
      • Full Lifecycle APM

      Prefix

      • Real-time Code Profiling
      Menu
      • Real-time Code Profiling

      Netreo

      • IT Infrastructure Monitoring
      Menu
      • IT Infrastructure Monitoring
  • Pricing
  • Solutions

      By Initiative

      • Application Performance Monitoring
      • Centralized Logging
      • Full Transaction Tracing
      • Error Tracking
      • Application & Server Monitoring
      • Real User Monitoring
      • Deployment Tracking
      Menu
      • Application Performance Monitoring
      • Centralized Logging
      • Full Transaction Tracing
      • Error Tracking
      • Application & Server Monitoring
      • Real User Monitoring
      • Deployment Tracking

      By Role

      • For Developers
      • For DevOps
      Menu
      • For Developers
      • For DevOps

      By Technology

      • Azure Monitoring
      • AWS Monitoring
      • Compatibility
      Menu
      • Azure Monitoring
      • AWS Monitoring
      • Compatibility

      By Language

      • .NET
      • Java
      • PHP
      • Node.js
      • Ruby
      • Python
      Menu
      • .NET
      • Java
      • PHP
      • Node.js
      • Ruby
      • Python

      By Initiative

      • Application Performance Monitoring
      • Centralized Logging
      • Full Transaction Tracing
      • Error Tracking
      • Application & Server Monitoring
      • Real User Monitoring
      • Deployment Tracking
      Menu
      • Application Performance Monitoring
      • Centralized Logging
      • Full Transaction Tracing
      • Error Tracking
      • Application & Server Monitoring
      • Real User Monitoring
      • Deployment Tracking

      By Role

      • For Developers
      • For DevOps
      Menu
      • For Developers
      • For DevOps

      By Technology

      • Azure Monitoring
      • AWS Monitoring
      • Compatibility
      Menu
      • Azure Monitoring
      • AWS Monitoring
      • Compatibility

      By Language

      • .NET
      • Java
      • PHP
      • Node.js
      • Ruby
      • Python
      Menu
      • .NET
      • Java
      • PHP
      • Node.js
      • Ruby
      • Python
  • Learn
      Resources
      • Blog
      • eBooks
      • Case Studies
      • Webinars
      • ROI Calculator
      • News
      Menu
      • Blog
      • eBooks
      • Case Studies
      • Webinars
      • ROI Calculator
      • News
      Technical
      • Documentation
      • Support
      Menu
      • Documentation
      • Support
      Resources
      • Blog
      • eBooks
      • Case Studies
      • Webinars
      • ROI Calculator
      • News
      Menu
      • Blog
      • eBooks
      • Case Studies
      • Webinars
      • ROI Calculator
      • News
      Technical
      • Documentation
      • Support
      Menu
      • Documentation
      • Support
  • Login

Centralized Log Management

Resolving application problems is easy when the right data is correlated and accessible. Retrace log management displays app and server errors in a centralized log with drill down and search capabilities, giving you the structure, access and context you need for faster troubleshooting and performance optimization.

Start Free Trial
main log dashboard

Centralized Log Management

Resolving application problems is easy when the right data is correlated and accessible. Retrace log management displays app and server errors in a centralized log with drill down and search capabilities, giving you the structure, access and context you need for faster troubleshooting and performance optimization.

Start Free Trial
Explore Logging Sandbox
main log dashboard
centralized-logging - transparent graphic

Centralized Logging

Access all of your application logs from a single place across all applications and servers

integrated-error-logs-2

Integrated Errors + Logs

See the full context around errors that show up in your logs with actionable insights for optimizing your apps

structured-logging-3 - transparent graphic

Structured Logging

Including objects, log tags and searchable properties adds the intelligence you need to optimize your time and app performance

Go from a log statement to full transaction trace

Integrated code profiling and log management extends APM functionality by enabling you to quickly leverage key performance metrics to eliminate bottlenecks.

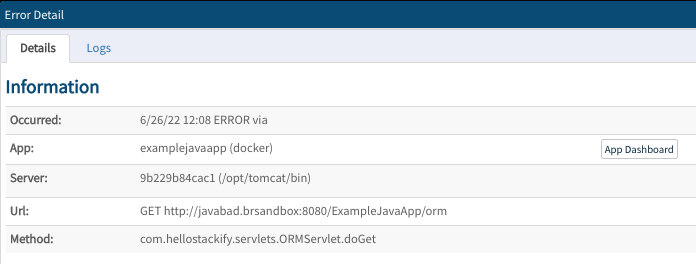
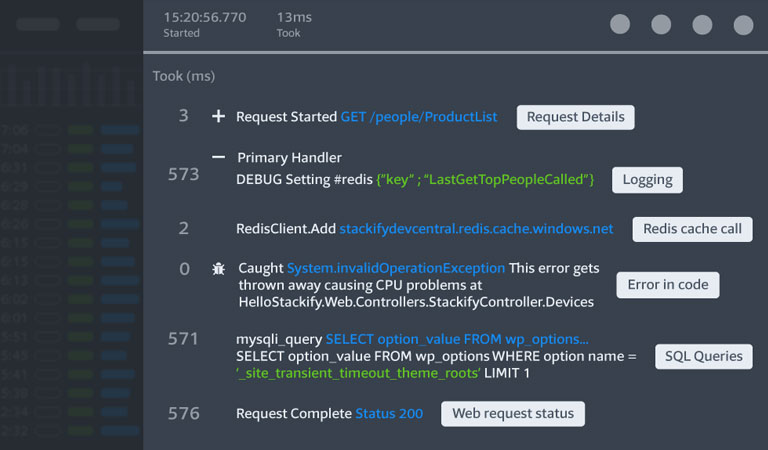
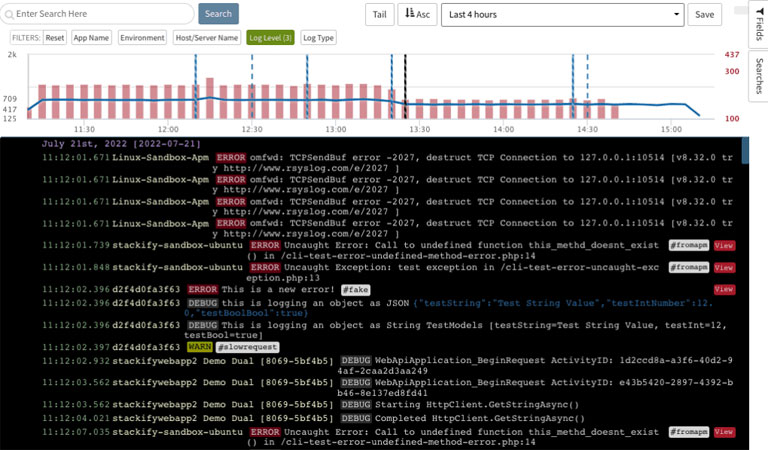
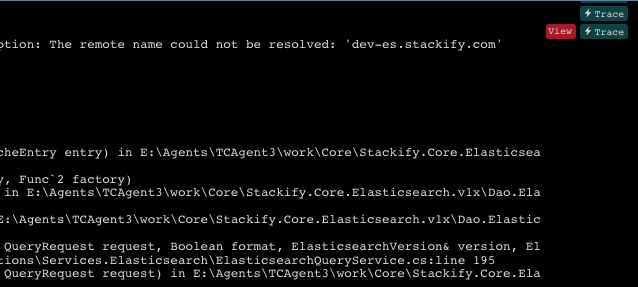
  • Get incredibly detailed transaction traces for your applications
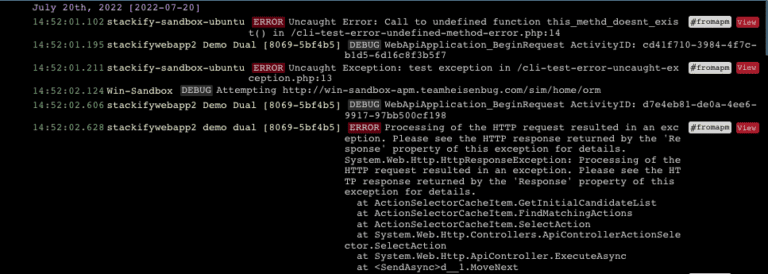
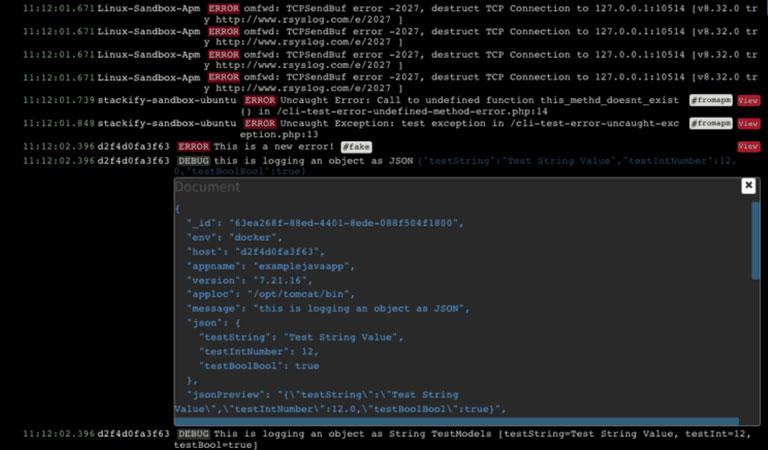
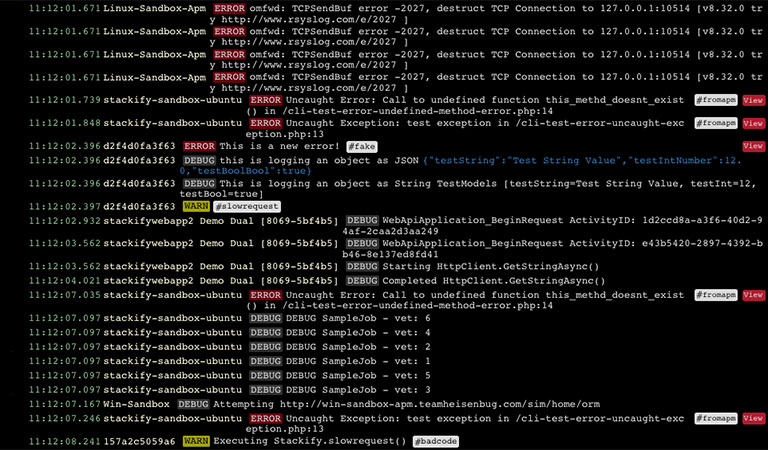
  • Traces include log statements, errors, SQL queries executed, external HTTP web service calls
Screenshot showing trace capability
Screenshot showing error detail

Get more intelligence about the errors in your logs

Get all the details you wish your logs had with no code changes. Retrace automatically collects the details you need to quickly troubleshoot application errors.

  • Web request details
  • Full stack trace
  • Related log messages

Shipping Your Logs to Retrace is Easy

Retrace supports common logging frameworks for most programming languages. A simple configuration change is all that is needed.

  • Programming language specific libraries
  • Web server logs
  • Syslog
  • Windows Events

Logging libraries for many other languages are also supported in addition to our REST API.

Java
.NET
PHP
Node.js
Ruby
Python
Java

Retrace supports Java logs via logback, log4j, or our Java SDK.

Example configuration for log4j:

<appender name="Stackify" class="com.stackify.log.log4j12.StackifyLogAppender">
    <param name="apiKey" value="YOUR_ACTIVATION_KEY"/>
</appender>
<root>
    <appender-ref ref="Stackify" />
</root>
.NET

Retrace supports .NET logs via log4net, NLog, Serilog, or our .NET SDK.

Example configuration for log4net:

<log4net>
   <root>
      <level value="DEBUG" />
      <appender-ref ref="StackifyAppender" />
   </root>
   <appender name="StackifyAppender" type="StackifyLib.log4net.StackifyAppender, StackifyLib.log4net" />
</log4net>
PHP

Retrace supports PHP logs via Monolog, log4php and Syslog.

View PHP logging documentation

Node.js

Retrace supports Node.js logs via Winston.

View Node.js logging documentation

Ruby

Retrace supports Ruby logs via the Rails logger.

View Ruby logging documentation

Python

View Python Logging documentation.

Log filtering screenshot

Advanced searching and filtering

To simplify troubleshooting and expedite issue resolution, advanced, full-text searching is available for your log messages, as well as filtering on any fields captured. Several quick filters help you quickly and easily identify where to focus for remediating issues. 

Enhanced log viewing

Perhaps the most low tech feature, but one of the most helpful!

  • JSON viewer
  • Colored log levels
  • View related log messages
  • Search by #tags
Screenshot of error trace
log tailing video

Real-time log tailing

Trying to troubleshoot something in production? Use Retrace to search and filter for exactly what you are looking for and then turn on tailing mode. The log viewer will automatically update with new logs in real time, conveniently providing critical data during active troubleshooting, so you don’t have to wait for log reports to be written to log files.

Structured logging

Go beyond saving a basic log message to separating out key data, in a structured way, for improved searching and log analysis. Without adding additional processing time, structured logs enable you to attach additional properties and index a Retrace log for extended searchability, which greatly improves the value and functionality of your log data.

Log.Debug("Test model object", new {test=”Hello World”, testInt=100, testBool = true});
log document

What our customers are saying

Retrace’s APM lets us monitor this and focus our development efforts where it matters most.

With redundant monitoring of Azure and Retrace and the really granular early alerts we’ve set up in Retrace, I feel much more confident about finding critical issues before they turn into fires.

Aaron Elder

Co-Founder I Crelate

View where your logs came from in your code

Some logging frameworks can track and report where the log messages originated from in your code. Being able to locate where your logs come from in your codebase can be very valuable for tracking down where bugs are occurring in your applications.

Log level screenshot

Prefix Is Your New Favorite Local Log Viewer

Netreo’s powerful code profiling is the heart of Retrace and Prefix. Our goal is to make it easy for to improve your code’s performance.

Stop sorting through messy log files. Bring all of your logs together to effortlessly locate issues. Explore the context of suspicious logs directly within the request, and jump directly from a log into a trace for effortless debugging.

  • Structured logging
  • View logs by request
  • Web request details
  • SQL queries
  • HTTP calls
Explore Prefix
Log filtering capability

Explore all of your logging fields

Retrace has many built-in fields for basic server info, errors, web logs, and Windows events. The field explorer makes it easy to see all the fields that exist, giving you proper context around your logs.

Monitor your logs

Retrace supports active monitoring of logs for extended, application-specific data, and enables you to find and save critical results automatically. If your app logs a certain message that is really important for you to be aware of, you can set up a monitor to run this query every few minutes and alert you if it finds a certain type or amount of results.

Log monitoring

Integrated errors make this the worlds best log aggregator

Get all the details you wish your logs had with no code changes. Retrace automatically collects the details you need to quickly troubleshoot application errors.

  • Web request details
  • Full stack trace
  • Related log messages
log tailing video

Works with your stack

Retrace works out of the box with popular programming languages, as well as common frameworks, such as Syslog, Web Server Logs, Windows Events, and more. View our complete list of supported integrations.

Java

.NET

Node.js

PHP

Python

Ruby

Java
Java
.NET
.NET
Node.js
Node.js
PHP
PHP
Python
Python
Ruby
Ruby
Previous
Next

View our complete list of supported integrations

Don’t Get Left in the Dark.
Get Started With Retrace Today.
Start Free Trial

14 day free trial – No credit card required

Get In Touch

  • Contact Us
  • Request a Demo
  • Start Free Trial
Menu
  • Contact Us
  • Request a Demo
  • Start Free Trial

7171 Warner Ave
Suite B787
Huntington Beach, CA 92647
866-638-7361

Facebook Twitter Youtube Linkedin

Products

  • Retrace
  • Prefix
  • Netreo
  • Stackify Hidden Menu Item
  • .NET Monitoring
  • Java Monitoring
  • PHP Monitoring
  • Node.js Monitoring
  • Ruby Monitoring
  • Python Monitoring
  • Retrace vs New Relic
  • Retrace vs Application Insights
Menu
  • Retrace
  • Prefix
  • Netreo
  • Stackify Hidden Menu Item
  • .NET Monitoring
  • Java Monitoring
  • PHP Monitoring
  • Node.js Monitoring
  • Ruby Monitoring
  • Python Monitoring
  • Retrace vs New Relic
  • Retrace vs Application Insights

Solutions

  • Application Performance Management
  • Centralized Logging
  • Code Profiling
  • Full Transaction Tracing
  • Application & Server Monitoring
  • Real User Monitoring
  • Retrace Deployment Tracking
  • Stackify Hidden Menu Item
  • For Developers
  • For DevOps
Menu
  • Application Performance Management
  • Centralized Logging
  • Code Profiling
  • Full Transaction Tracing
  • Application & Server Monitoring
  • Real User Monitoring
  • Retrace Deployment Tracking
  • Stackify Hidden Menu Item
  • For Developers
  • For DevOps

Resources

  • What is APM?
  • Pricing
  • Case Studies
  • Blog
  • Documentation
  • Free eBooks
  • Free Webinars
  • Videos
  • ROI Calculator
  • Support
  • News
Menu
  • What is APM?
  • Pricing
  • Case Studies
  • Blog
  • Documentation
  • Free eBooks
  • Free Webinars
  • Videos
  • ROI Calculator
  • Support
  • News

Company

  • About Us
  • News
  • Careers
  • GDPR
  • Security Information
  • Terms & Conditions
  • Privacy Policy
  • Sitemap
Menu
  • About Us
  • News
  • Careers
  • GDPR
  • Security Information
  • Terms & Conditions
  • Privacy Policy
  • Sitemap

PO Box 2159
Mission, KS 66201
816-888-5055

Facebook Twitter Youtube Linkedin

© 2022 Netreo

Start Your Free Trial Now
No credit card required. 14 days free.
. .