Stackify is now BMC. Read theBlog

Top 18 APM Tools (Application Monitoring) You Should Consider

By: mwatson
  |  November 29, 2016
Top 18 APM Tools (Application Monitoring) You Should Consider

Every business is highly dependent on software these days. Ensuring that all of your organization’s mission-critical applications are running optimally at all times is priority #1! There is a wide range of application performance management and application monitoring (APM) tools on the market available for developers, DevOps teams, and traditional IT operations.

There is a lot of gray area as to what APM is and who it benefits within an organization. In this post, I’ll define what APM is, share some tips for selecting a tool, and list the top APM tools along with their features.

Defining Application Performance Management (APM)

To fully manage and monitor the performance of an application, it requires collecting and monitoring a lot of different types of data. An APM solution is like the black box of an airplane. Application monitoring tools ensure that developers are not flying blind!

Components of a complete application performance management solution:

  • Performance of individual web requests or transactions
  • Usage and performance of all application dependencies like databases, web services, caching, etc
  • Detailed transaction traces down to specific lines of code
  • Code level performance profiling
  • Basic server metrics like CPU, memory, etc
  • Application framework metrics like performance counters, JMX mBeans, etc
  • Custom applications metrics created by the dev team or business
  • Application log data
  • Application errors
  • Real user monitoring

Read our guide on What is APM to learn more.

APM Tools to Use While Writing Code

Typically when you think of APM tools, you think of running them on production servers, but there are also APM tools that developers can use on their workstation while writing and testing their code. Thanks to detailed transaction tracing, which is powered by lightweight code profilers or other technology, you can easily see these types of details and more.

Depending on which programming language you are using, there are several different developer tools you could use for this. The features and functionality of these tools vary wildly. Some require a lot of code changes or configuration, some don’t require any.

These developer tools are primarily designed to run on your workstation, although some may also work on a server.

These types of APM tools are a lifesaver for developers. Once you start using them, they will become part of your standard tool-chain. They are great at answering that question of “What did my code just do?”

Read more: Using developer APM tools to find bugs before they get to production

Tips for Selecting Application Monitoring Tools

Application performance management tools have traditionally only been affordable by larger enterprises and were used by IT operations to monitor important applications. They have been used for what I always call business transaction monitoring. In the last few years, APM tools have become affordable and a must have for all businesses. They are also being used more and more by developers and not just IT operations for application performance monitoring. APM is a big part of the DevOps movement.

Key things to consider:

  • Programming language support
  • Cloud support (Azure, AWS, Heroku, etc)
  • SaaS vs On-premise
  • Pricing
  • Ease of use

List of APM Tools

New Relic APM

New Relic has championed the idea of a SaaS based APM and is one of the industry leaders in application performance management. New Relic also provides APM for mobile apps, advanced browser performance monitoring and most recently added infrastructure monitoring.

  • Languages: .NET, Java, Ruby, Phython, Nodejs, Go, PHP
  • SaaS only
  • Application Monitoring provides performance trends at-a-glance
  • Browser Monitoring gives insights from the user perspective
  • Track performance of individual SQL statements
  • Low-impact production thread profiler
  • Code-level diagnostics
  • Cross-Application Tracing
  • Monitor critical business transactions independent of application

Cost: $75-600 per month per server, cheaper annually

Compare: Retrace vs New Relic & New Relic alternatives

AppDynamics

AppDynamics caters to larger enterprises and offers a SaaS APM option as well as an on-premise option. Self-described as an application intelligence platform, AppDynamics monitors application performance and then derives insights into how application performance is impacting business operations. From data collection to processing and then deriving knowledge from your data, AppDynamics provides full visibility into exactly how application performance is affecting your business.

  • Languages: .NET, Java, PHP, C++, Python, Node.js
  • End-to-end transaction tracing
  • Code level visibility
  • Dynamic baselining and alerting

Cost: $230 per month per server

Stackify Retrace

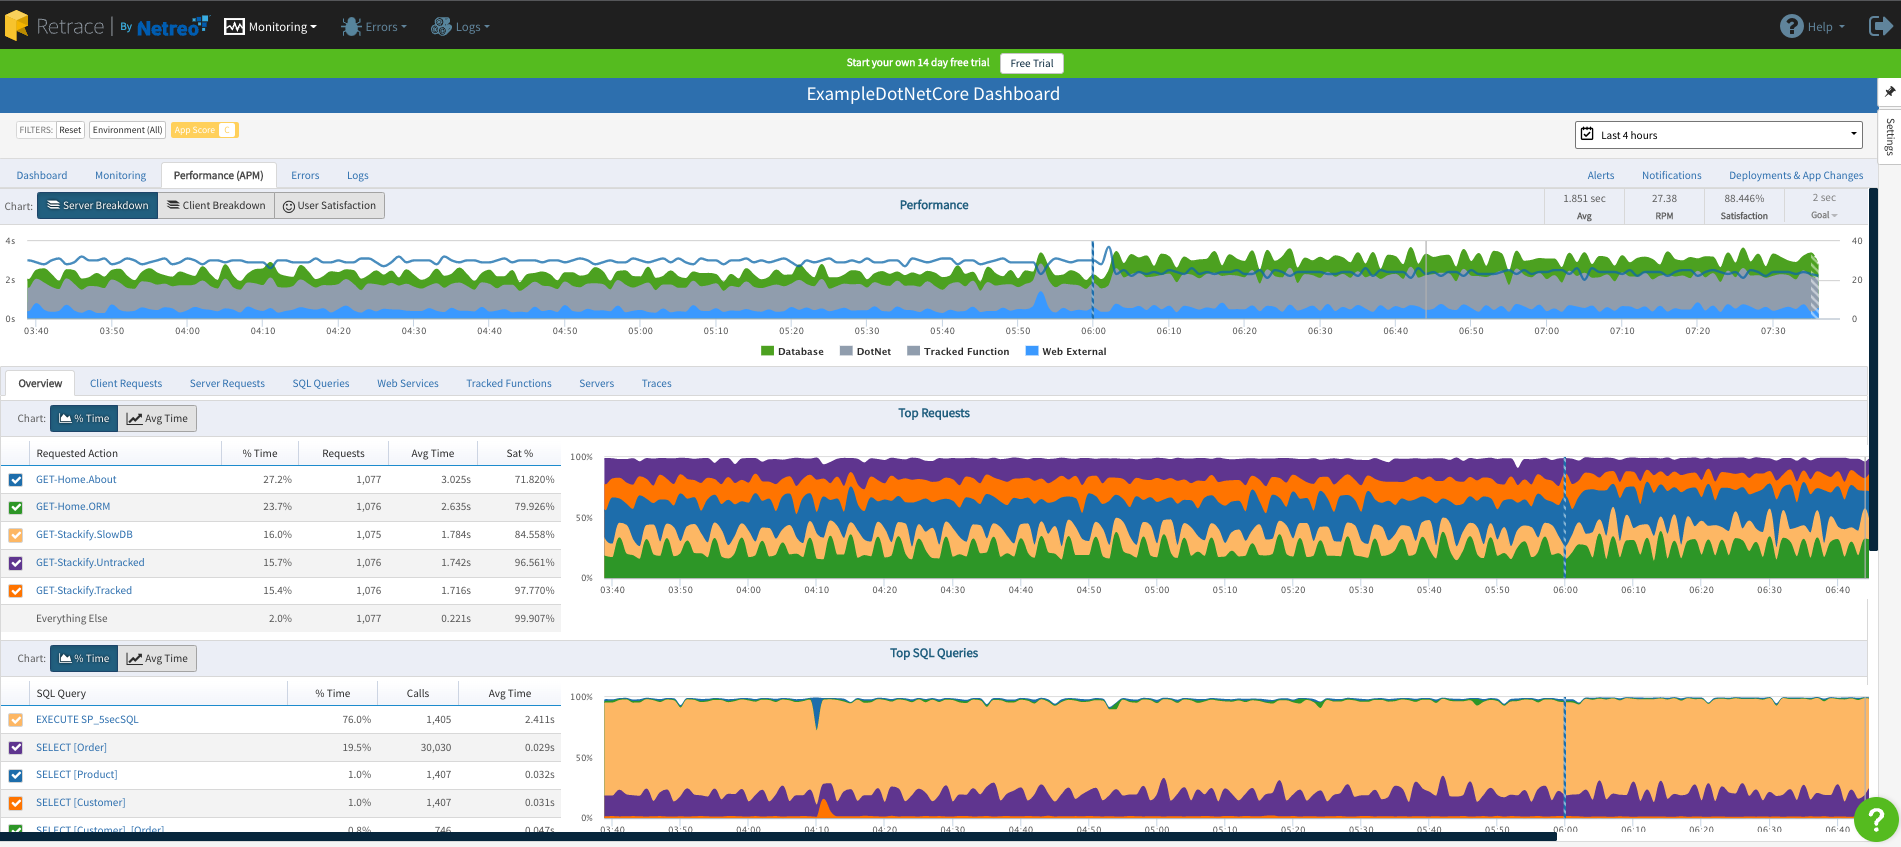
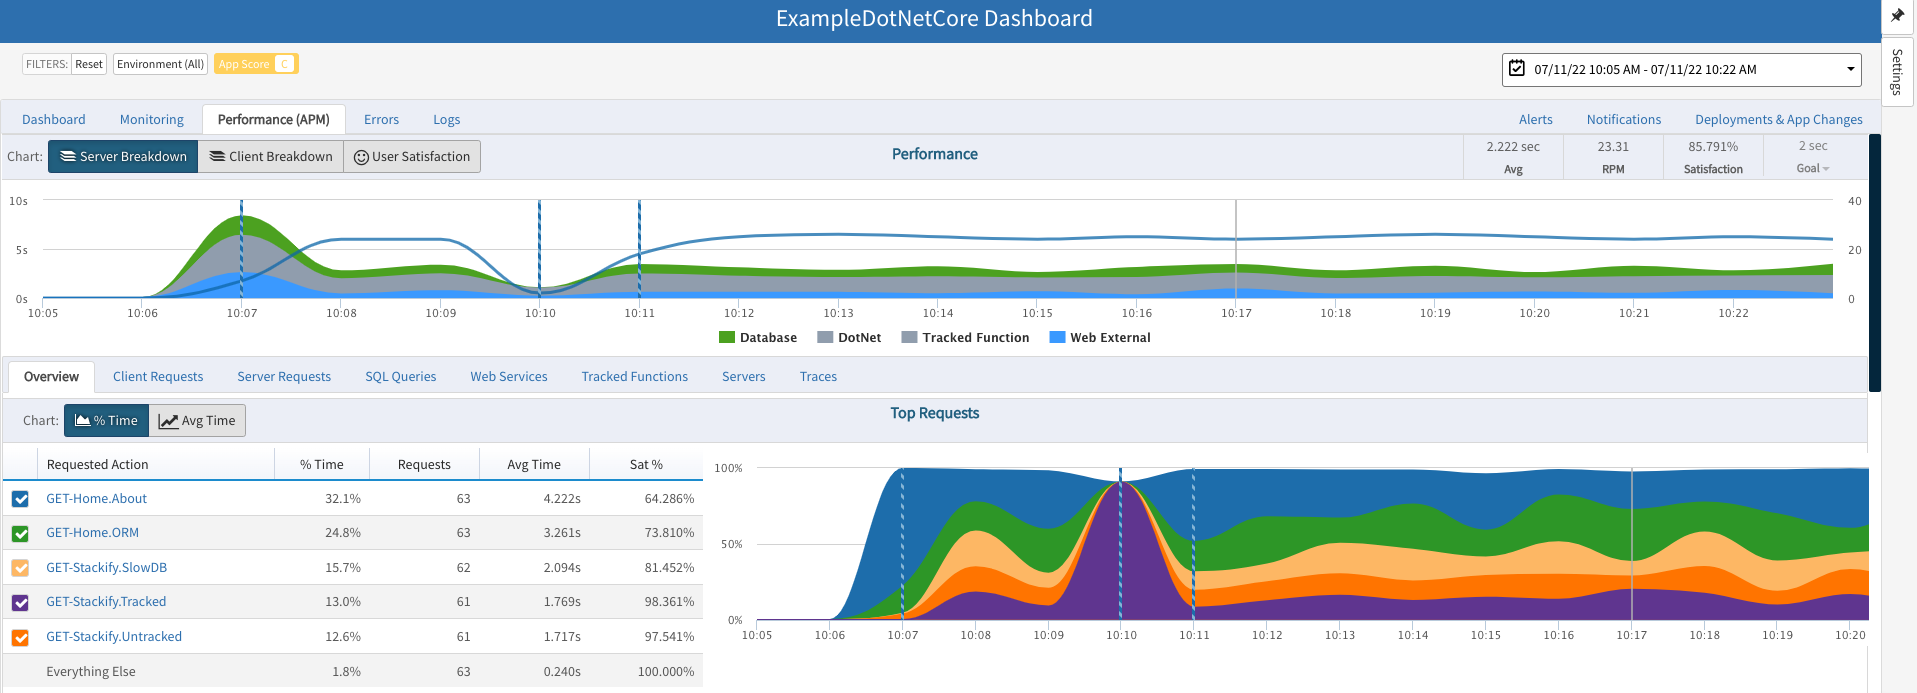
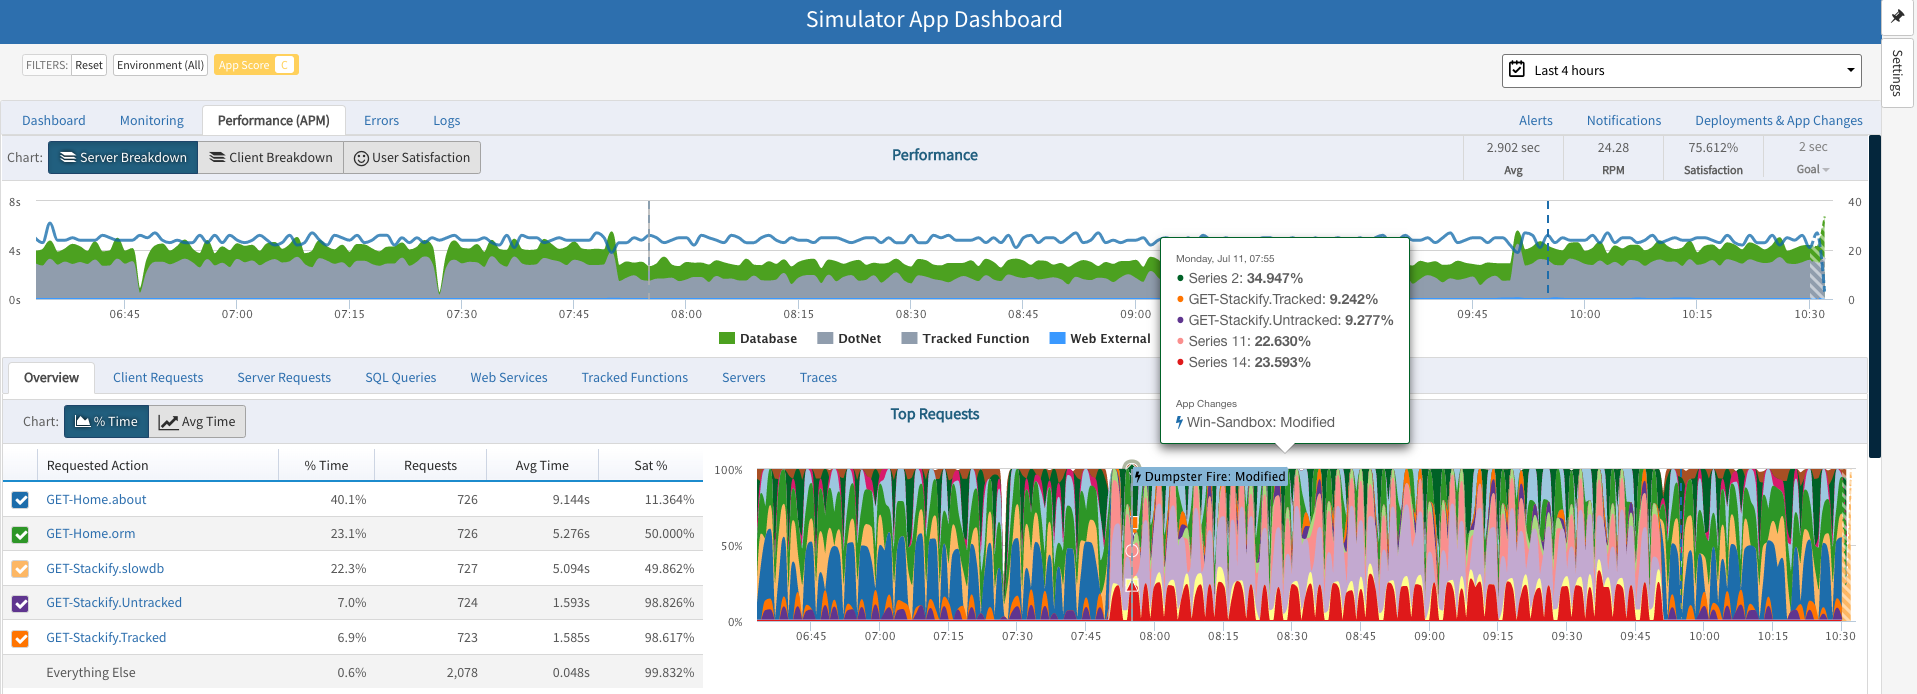
Retrace is an affordable SaaS APM tool designed specifically with developers in mind. It is designed to help developers optimize the performance of their applications in QA and “retrace” application problems in production via very detailed code level transactions traces. A free workstation level APM tool called Prefix helps developers as they write and test their code. Retrace is focused on being simple to use and affordable for developer teams of all sizes.

  • Languages: .NET, .NET Core, Java
  • SaaS based
  • Integrated errors & log management
  • Detailed code level transaction traces
  • Optimized for developers
  • Includes application metrics & server monitoring
  • Very low overhead
  • Easy to use and install

Cost: $25-50 per month per server, $10 for non-production

Dynatrace (Compuware APM)

DynaTrace, previously known as Compuware APM, is touted as the first self-learning Application Performance Monitoring tool. Through its agent is provides auto-discovered topology visualizations of applications and their components. This sets DynaTrace apart as an application performance tool.  However, the one thing to keep in mind is that it takes time to learn. You may have to wait for enough data points to come in before you stop seeing false positives.

  • Languages: .NET, Java
  • SaaS or On-premise
  • Visualizes application topology, deployments and environment changes in real-time.
  • Performance issues in web-scale applications discovered with artificial intelligence.
  • Auto-discovers all application components and dependencies end-to-end.
  • Entire application topology is visualized in an interactive infographic.
  • Dynatrace automatic baselining learns, how your application works.

Cost: $216 per month per server for SaaS version

Scout (SolarWinds)

Scout provides a good APM for Ruby on Rails. However, it requires expansions into their “Server Monitoring” and “DevTrace” offerings for a fully rounded solution. The lack of other available languages makes this APM product somewhat niche.

  • Languages: Ruby on Rails
  • Memory Leak Detection
  • Slow Database Query Analysis
  • Github Integration
  • Automatic Dependencies Population

Cost: $59 per month per server

TraceView (SolarWinds)

This product started as Tracelytics, was acquired by AppNeta, and is now part of SolarWinds. All the standard dashboard and drill down capabilities that you have come to expect with SolarWinds are naturally included.

  • Languages: .NET, JAVA, PHP, Python, Ruby on Rails, Node.js, GO
  • Advanced visualization with filtering & drill-down
  • Cross-host, distributed transaction tracing
  • Latency, host, and error-based alerting
  • Distributed Transaction Tracing
  • Error reporting at every layer
  • Machine-level metric collection & charting
  • Real User Monitoring (RUM)
  • Java Management Extension (JMX) monitoring support

Cost: $79 per month + Storage $19 per GB per month

ManageEngine Applications Manager

Applications Manager has code-level diagnostics for .NET, Java, and Ruby on Rails, applications. As well as KPI database monitoring out of the box. It has the ability to auto-discover application topology and present visualized dependencies. ManageEngine Applications Manager provides basic application monitoring tool.

  • Languages: .NET, Java, and Ruby on Rails
  • Scale up to 50,000 applications with Enterprise Edition.
  • Auto-discover application topology and visualized dependencies
  • Measure End-User Satisfaction Levels with Apdex Scores
  • Monitor Middleware & Messaging Components
  • Customizable Reports and Dashboards

Cost: Starts at $795 (perpetual license)

Application Insights (Microsoft)

We included App Insights in our list, but it is arguably not a full-fledged APM solution. It does not do code level profiling but instead provides some high-level performance details only for SQL queries and web service calls. We would call it “APM light”.

Cons: No reporting per SQL query. No transaction tracing view. Does not correlate logs, errors, and request details well. No reporting across apps. Does not work for non web apps without major code changes. Can not track the performance of any line of code in your app via custom CLR profiling.

  • Languages: .NET, Java
  • Application dependency mapping
  • Integrated into Azure portal
  • Advanced reporting and analytics capabilities

Cost: $15 per month per server + data charges

Compare: Retrace vs Application Insights

Riverbed SteelCentral

Riverbed’s SteelCentral is another Enterprise Class APM solution.  Multiple Riverbed components are required to get the same in-depth results that come from other singular solutions. The SteelCentral AppResponse, AppInternals and Portal are all required to get a holistic view that you get through many other products.

I found this user’s review to be very helpful especially when you take into account that these are both physical and virtual appliances.  “Intuitive use: The GUI isn’t intuitive and several elements of its design differ in appearance and function with other parts of the interface. Reliability: Issues interfering with the deployment and use of the product has made its use reduced in scope.” –  via IT Central Station

  • Languages: .NET, Java, and Ruby on Rails
  • End-user experience monitoring
  • Transaction analysis
  • SLA configurations, alerting, and reporting capabilities.
  • Track performance by application, user, transactions, business division, and location

Cost: $90-200 per month per server

Microsoft System Center Operations Manager (SCOM)

SCOM is a decent out of the box APM system. Once the overhead of setting up the appropriate Management Packs, System Center Operations Manager offers a significant value in the realm of APM. However, there is a decent level of care and feeding required to maintain its usefulness. Also to get intuitive dashboards either significant effort or 3rd party plugins are required.

  • Languages: .NET, Java, Expandable with custom/3rd party Management Packs
  • Deep SQL metrics and profiling available out of the box.
  • Extensive IIS, OS, and Network Monitoring capabilities out of the box.

Cost*: $1323 – $3607 / Azure Offering Prices vary on Licensing Agreements
(*See Microsoft Licensing for details as this per Core Costs)

Dell Foglight

Provides User Experience Monitoring, out of the box analytics dashboards, in-depth cross connection mapping between applications and databases. Quest creates a good baseline for the APM requirements, but the interface can be somewhat confusing and clunky to find the details you are looking for.

  • Languages: .NET, Java, AJAX, IBM WebSphere WQ
  • Trans Action Recording
  • User Experience Monitoring
  • SLA Dashboards
  • Funnel analysis of multi-step transactions linking directly back to page content data.

JenniferSoft

Languages: .NET, JAVA, PHP

JenniferSoft APM solution provides for a true Real-time Dashboard and Topology view on top of wall the other standard APM features. Not to mention it is also specially designed to be a Low Overhead solution. That means that they specifically designed it to take the least resources possible.

  • Languages: .NET, Java, PHP
  • Integrated Dashboarding  with real-time user statistics.
  • Designed to be less impactful from other solutions, reducing noise and false positives.
  • Individual Transaction Monitoring

CA Application Performance Management

CA is recognized for being versatile in its offerings and being able to meet the needs of its customers. It has done no less with its APM solution as well. With End-User Experience, APM Team Center Dashboards, and Companion Software CA can provide as deep of insights as any other of APM solutions out there.

  • Languages: .Net, Java, PHP, Node.js, Docker Containers, Cloud Foundry, AWS
  • Team Center provides a good dashboard for quickly navigating the details you to dig into the issues.
  • Automatic transaction traces and a unified end-user view into transactions, including mobile app and synthetic or web-based applications.
  • APM agents that get value in minutes from being deployed.

Nastel

Nastel provides another out of the box solution for deep APM analytics and discovery. However, Nastel is a Middleware centric business transaction tool and like most other Application Performance Management Vendors it is focused on that Middleware business transaction.

  • Languages: .Net, Java
  • Real-time monitoring with sub-second analytics
  • Pre-built processing rules and dashboards
  • Complex Event Processing (CEP) engine for advanced application analytics and rules
  • Intuitive, easily defined dashboards provide insights at a glance

IBM

IBM has been a mainstay in enterprise class solutions for more than half a century now.  With their Application Performance Management offering it precisely what you would expect it to be. IBM provides expansive SaaS offering with multiple tiers allowing for you to go as deep as you desire. The deepest level allows for Database, Code level Stack Traces, and automatic Hung Transaction Resolution.

  • Languages: IBM WebSphere
  • Predictive Analytics show possible issues before they occur.
  • Customizable Dashboards allows you to focus in on the key issue areas.
  • Transaction tracking shows where the issues are occurring.
  • End-User Experience allows you to address issues before you client notifies you.

Cost: Starts at $185.00 Per Month

SmartBear (formally Lucierna)

SmartBear absorbed Lucierna’s APM into its AlertSite offering that is geared specifically towards REST and SOAP APIs. This limitation along with pricing makes this a niche APM product geared towards a select market. SmartBear is poised to expand this product creating a major player in the Application Performance Management vendors.

  • At this time they are somewhat limited in scope, however API monitoring is superb.
  • Monitoring APIs continually throughout the CI cycle and detecting and fixing issues early on contributes to continuous deployment and DevOps initiatives.
  • Monitors chained API transactions where the APIs need to be invoked in sequence, and contextual data needs to be passed from one call to the next.

IDERA Precise

IDERA has made its name through deep SQL Monitoring capabilities. Precise is no different, leveraging the deep Database structure IDERA has expanded Precise into true APM solution. IDERA is known for having an intuitive dashboard and allow for quick insights, Precise uses these dashboards to make it one of the best APM Monitoring Tools available today.

  • Languages: .Net, Java
  • End-to-end transaction visibility quickly isolates issues anywhere in the stack
  • Recommended corrective actions
  • Historical analysis and trending
  • Database stores contextual details to correlate transactions
  • Scalable performance for mission-critical business processes
  • Multi-platform support spans a diverse range of systems

Application Monitoring Tools Conclusion

There are a lot of application performance monitoring tools on the market. Most all of them target large enterprises and IT operations. Stackify Retrace separates itself from the group by being focused on developers instead of IT operations. Retrace is also very affordable while still providing common features needed to optimize and monitor the performance of your apps.

Improve Your Code with Retrace APM

Stackify's APM tools are used by thousands of .NET, Java, PHP, Node.js, Python, & Ruby developers all over the world.
Explore Retrace's product features to learn more.

Learn More

Want to contribute to the Stackify blog?

If you would like to be a guest contributor to the Stackify blog please reach out to [email protected]