Finding the root cause of application performance issues is the crux of every app troubleshooting exercise. So why don’t more APM tools provide great root cause analysis? The trouble is – pun intended – the cause of a slow application can come from different sources, many outside the application itself. So APM tools that focus on the ‘A’ may never truly find the root cause.
That’s one big reason we call Retrace a full life cycle APM solution. Built for developers by developers, Retrace includes the practical tools developers need to get a complete picture of application performance. By monitoring and reporting on the resources outside the application that impact performance, as well as deep performance metrics from within the application, Retrace presents the data you need for accurate root cause analysis.
Troubleshooting application problems is easy when you can correlate all of your data together. Retrace’s centralized logging and error tracking features combine to create a Log Dashboard powerhouse, pinpointing bugs, diagnosing slow dependencies and analyzing your application’s performance down to the root cause of any problem.
Retrace log management consolidates and centralizes your application, server and event logs into a singular, searchable Log Dashboard. A combined view simplifies overall troubleshooting, and consolidated metrics reveal the relationships you need for improved root cause analysis. Let’s take a closer look at the key features, functions and benefits you receive from your Retrace Log Dashboard.
Want to see where a log came from or need more details on where an error originated? Jump from our Log Dashboard to a detailed transaction trace by clicking on the Trace button on the right side of the dashboard. Retrace then presents related log messages, errors, SQL queries executed and external HTTP web service calls.
Intuitive and interactive, Retrace streamlines troubleshooting and app performance optimization by providing access to robust APM capabilities from virtually every screen. In this case, jumping to a full transaction trace from the Log Dashboard helps you quickly pinpoint issues down to the code.
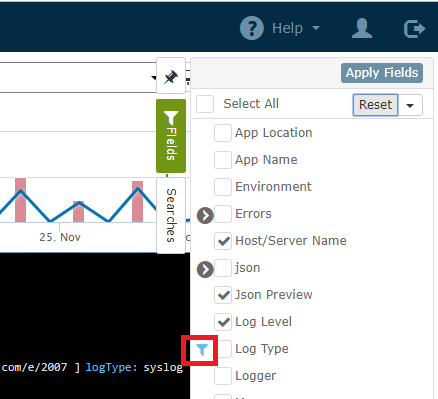
Retrace provides built-in filters, so users can easily drill down into logs and identify critical metrics. For example, to view only logs from a certain server or IIS logs for a certain app, simply set a log filter for that server or app. Retrace users set log filters in two simple ways:
When you’re through, remove filters by simply clicking the Reset button in the fields panel or the filter bar.
The Retrace Log Dashboard includes search capabilities to quickly identify desired log entries. Retrace’s search functionality is full text indexing powered by Lucene/Elasticsearch. Below are some of the ways you can use Retrace log dashboard search capabilities:
By default, searches use the AND operator and must match all terms. To search for an application name (app1) and a client ID (21102), for example, you can use the operator:
appname:app1 AND 21102
All results in your search will include only logs from app1 that contain the client ID 21102.
This functionality also extends to Boolean operators AND, +, OR, NOT, as well as parentheses, which can be used for groupings:
appname:app1 (21102 OR 21203)
All results in this search will include only logs from app1 and contain the client ID 21102 or client ID 21203.
Finally, you can use quotes around the search that require the terms be matched as an exact phrase. For example, using "client 2017" will return only results with the entire phrase, client 2017.
Retrace’s tagging functionality enables you to “tag” important words or phrases in your log messages using a hashtag(#) symbol as seen below. You will then be able to search by applying filters and fields for these tagged words in the Log Dashboard. No worries, if you cannot remember the exact tag. All tags used in your logs will appear in the Fields menu under the category tags. For example:
#restapi – will return log results that only contain the tag “restapi”
Do you have a term or set of terms you are constantly searching for? Save time by saving your search with Retrace’s “Saved Search” functionality. All you have to do is search the term or terms you want to save and then click the Save button in the upper right hand corner of the log dashboard.
Your saved searches will then appear in the Searches slider menu on the right side of the log dashboard. You can access searches by clicking the Searches button right below where you access fields to search your logs.
Retrace enables you to view all of your logs as they occur in real time by using the Real-Time Tailing feature. By clicking on the Tail button at the top of the dashboard, you can view new logging statements as they occur. This enables you to see logging within your applications across multiple servers simultaneously in real time. Many customers use this feature when they are testing their QA or Dev environments to see their applications processes as they test.
Log Dashboard features combined with error tracking capabilities present the data you need for efficiently troubleshooting application performance problems. When viewing errors on your Log Dashboard, you have access to information specific to that error by clicking the View button on the far right hand side of the Log Dashboard.
This View option opens an error details window that gives you additional data specific to that error, such as URL, full-stack trace, user details, header, session and cookie values. In addition, clicking the Logs tab inside Error Detail presents all the logs around each error.
These are just some of the Error and Log capabilities that Retrace offers. To hear more about Retrace’s Error and Log Dashboard functionality, visit the Stackify by Netreo documentation.
Stackify's APM tools are used by thousands of .NET, Java, PHP, Node.js, Python, & Ruby developers all over the world.
Explore Retrace's product features to learn more.