At Stackify, we’re all about helping you improve your application’s performance. We have actually developed two code profilers ourselves. Because of that, we like to think we know a thing or two about code profiling.
Today I want to talk about the three different types of code profilers, describe the differences between them, and recommend some tools for your toolbox.
Typically code profilers are used by developers to help identify performance problems without having to touch their code. Profilers can answer questions like, “How many times is each method in my code called?” and, “How long do each of these methods take?” Profilers also track things like memory allocations and garbage collection. Some profilers can even track key methods in your code, so you can understand how often SQL statements and web services are called. In addition, some profilers can track web requests and train those transactions to understand the performance of transactions within your code.
Code profilers can track all the way down to each individual line of code. However, most developers only use profilers when chasing a CPU or memory problem, and need to go out of their way to try and find those problems. This is because many profilers make applications run a hundred times slower than usual. While most consider profilers to be a situational tool not meant for daily use, code profiling can be a total lifesaver when you need it.
Profilers are great for finding the hot path in your code. Figuring out what is using twenty percent of the total CPU usage of your code, and then determining how to improve that would be a great example of when to use a code profiler. In addition, profilers are also great for finding memory leaks early, as well as understanding the performance of dependency calls and transactions. Profilers help you look for methods that can lead to improvement over time. A former mentor once told me, “If you can improve something one percent every day, then over the course of a month, you’ll improve by thirty percent.” What really makes a difference is continued improvement over time.
There are two different types of code profilers: server-side and desktop. A server-side profiler tracks the performance of key methods in pre-production or production environments. These profilers measure transaction timing, such as tracking how long a web request takes, while also giving you increased visibility into errors and logs. An example of a server-side profiler would be an application performance management tool, or APM, for short.
Desktop code profiling is slower and requires a lot of overhead, potentially making your app much slower than it should be. This kind of profiler usually tracks the performance of every line of code within each individual method. These types of profilers also track memory allocations and garbage collection to help with memory leaks. desktop profilers are very good at finding that hot path, figuring out every single method that’s being called, and identifying what uses the most CPU.
But there’s also another solution. For the sake of simplicity, we’ll call it a hybrid profiler.
These hybrid code profilers merge key data from server-based profiling with code-level details on your desktop for use every day. These profilers provide server level insights combined with the ability to track key methods, every transaction, dependency calls, errors, and logs.
For server-side code profiling, most companies use APMs. At Stackify we’ve developed a product called Retrace.
Some options for desktop code profilers include Visual Studio, NProfiler, and others.
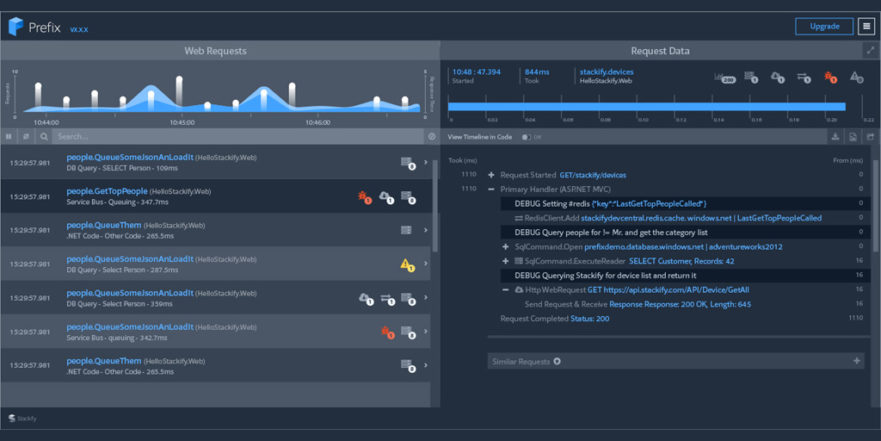
There are very few true hybrid code profiling solutions. Among those is our own hybrid profiler we call Prefix, which is free to use.
When comparing server-based and hybrid code profilers keep in mind a few things. Many profilers must be built into the code itself. This is what causes most profilers to make applications run slow and is also why they tend to be utilized in specific circumstances.
Very few profilers, like Prefix, are able to collect data from the outside looking in.
Few APMs can be installed on your server without any changes to the code. Most APMs require code changes and/or multiple config changes.
Stackify's APM tools are used by thousands of .NET, Java, PHP, Node.js, Python, & Ruby developers all over the world.
Explore Retrace's product features to learn more.


