About a year ago Microsoft released the Azure Service Profiler which is designed to be a lightweight profiler for ASP.NET applications. They recently enabled it to work with Application Insights and it is easy to enable for Azure App Services. Since we use App Services and love anything to do with app performance, I thought I would give it a try and see how it compares to other tools.
Note: The Service Profiler is still advertised as a “preview” offering and is not GA.
It is a transaction profiler for ASP.NET apps. It is designed to work with ASP.NET apps deployed anywhere, even outside of Azure. However, it uploads the collected data to Azure table storage where the data is then processed by Microsoft. So the name “Azure Service Profiler” is perhaps a little confusing because it can profile more than Azure. It also isn’t a true “.NET CLR profiler” because it uses ETW for data collection, not normal code profiling techniques.
It is designed to collect data in relation to individual web requests, or essentially individual transaction traces. I have written before about how there are 3 types of .NET profilers. Service Profiler is weirdly a mix of all 3 types. A standard profiler, transaction tracing and APM.
Service Profiler is a performance analysis tool used by teams at Microsoft running large-scale services in the cloud, and is optimized for troubleshooting issues in production. – Microsoft
You can play with their online demo to get an idea of what type of data it collects.
Here is a screenshot showing how it plots out the performance of a single action in your app, which is a cool visual to understand percentiles.
If you select a trace for a specific request, you can dive into lots of gory details.
BLOCKED_TIME, EventData, OTHER, dynamicClass_lamda_method, C3PO, R2D2, etc
My immediate reaction to this is… WTF does all this mean?
My screenshot above is just a fraction of the entire trace of what it collected. It provides an overwhelming amount of detail. I feel like I should have a computer science degree to figure it out (which I don’t have). Out of all details it provides, all I can really tell is it looks like my request is doing some database queries. However, I can’t tell what the SQL query was. So… ?
It looks like Microsoft was aiming to help provide every possible detail to help developers solve really hard problems. If I was doing hard core performance tuning, I could see how this could be useful. But if all I want to know is why did my request take 3 seconds… it provides an avalanche of data.
I just want to know what the SQL query is that was slow. I want actionable data I can quickly understand, fix the problem, and go on about my day.
Being able to use it on my dev box is awesome! I can totally see using this for performance tuning during development, just as you would use the Visual Studio Profiler or ANTS. Installing it is simple. I logged in to http://azureserviceprofiler.com and created a data cube for my dev box. Downloaded the agent and started it up. It runs as a simple console app. You can see how it subscribes to various ETW events. It also easy to install on Azure App Services via Application Insights.
By default, it only profiles 5% of your requests and you can modify the sampling rate to adjust it as you see fit. For a dev box you probably want to increase it to 100% sampling so you can quickly find any request to inspect. BTW, it will be interesting to see how it compares to Prefix over time. The combination of the two would be amazing.
After changing it to sample 100% and letting my browser auto refresh a page for a while, I went back in and played with the data it collected.
It noticed that my request has an exception on every request that gets thrown away. That is really nice.
When I selected a specific trace I was able to find my exception in the trace.
Like the online demo, I can tell that my code is running 8 SQL queries, but I can’t see what the SQL statements are or any real details about it. To be really useful, you need the raw SQL statements.
OK this time, let’s compare my code to what the trace looks like.
Here is my code. A really simple MVC action that downloads a web page with the HttpClient.
public async Task HttpClientAsync() { log.Debug("Starting HttpClient.GetStringAsync()"); string data; using (HttpClient hc = new HttpClient()) { data = await hc.GetStringAsync("http://stackify-nop-prod.azurewebsites.net/blog"); } log.Debug("Completed HttpClient.GetStringAsync()"); return Request.CreateResponse(HttpStatusCode.OK, data); }
But here is how it looks in the trace. So obviously the code only does an HTTP call and that should have taken the whole 324-330ms. In the trace it shows it took 1.15ms and then you can see a AWAIT_TIME of 324.77. The other thing that is weird is the “HTTP Activities” part is separate and that part actually shows the URL that was downloaded in only 0.04ms (not 324ms).
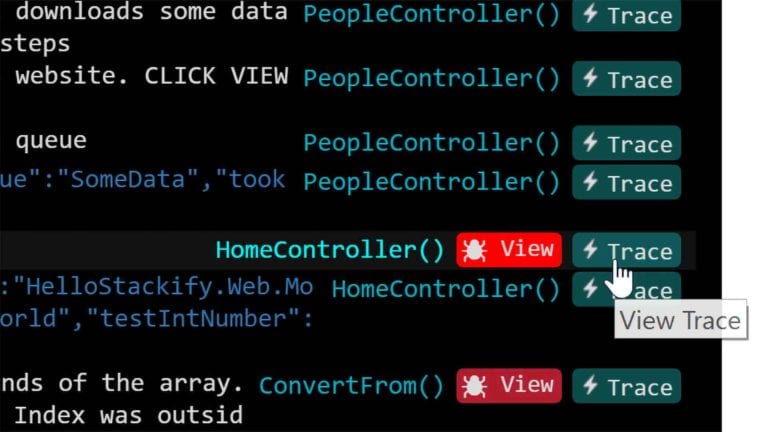
As a comparison, here is how Retrace/Prefix displays the same type of information (including the log statements).
The best thing I have seen about the profiler is that it tracked some methods that took a lot of time in my code all by itself. In this example I can see that JSON deserialization is taking a lot of time. Awesome!
Microsoft claims that the profiler is built for running against production applications. From my testing, it collects a lot of detailed data. The real question is can you run it at all times like an APM solution, or is it designed to run for a short period of time to try and capture detailed data about a problem in production. Even being able to use it occasionally could be very useful for chasing down hard problems.
Service Profiler makes it easy to collect performance data while your service is handling real production load, collecting detailed request duration metrics, deep callstacks, and memory snapshots – but it also makes sure to do this in a low-impact way to minimize overhead to your system. – Microsoft
Any type of profiling or tracing of web requests adds overhead of some form. The question is really how much overhead and is it acceptable for production servers.
I tested the Service Profiler running via App Services in tandem with Application Insights as well as standalone on an Azure VM. I used loader.io to give it some constant load. I tested the Service Profiler with all default settings, including the 5% default sampling rate.
My test apps were a demo nopCommerce app as well as a custom app that has a bunch of common test scenarios that I use for testing Retrace. I tested sync, async, and various scenarios.
Response times went up slightly. Sometimes up to 50 milliseconds higher per request, most likely when sampling kicked in for the request.
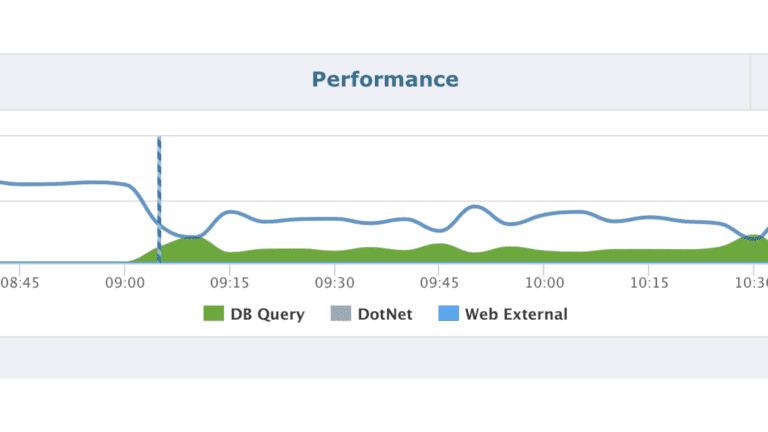
Here is a screenshot showing my CPU and memory usage difference on an Azure App Service. The chart actually starts with the Service Profiler enabled. After it is disabled you can see that memory goes down a lot and the CPU (as measured in seconds here) went down about 10%. That 10% (relative) or so CPU change was consistent in my testing on an Azure VM as well.
All types of profiling, tracing, or logging adds some amount of overhead. From my testing, I would say it is safe to use in production. Overall the CPU and response times increased 5-20% (relative) which is relatively low and similar to other APM solutions. It would never be zero. So yes it is safe!
Probably not since the data it collects isn’t very valuable unless you are trying to troubleshoot a really complicated problem. If all you want is stats around how long web requests are taking, Application Insights or Retrace is a better option and probably have less overhead. Since it can’t do things like you show you a SQL query, that also greatly limits the functionality for me. But I still believe it is an awesome tool for solving hard problems, it is just too complicated to use for simple problems. I can see using it in QA for performance tuning for sure!
The other unknown is what Microsoft will charge for the Azure Service Profiler once it comes out of preview. Perhaps it is just bundled in to the pricing of Application Insights or it could be a premium feature.
Overall, Microsoft has done a good job optimizing the overhead of it and my testing backs their stance that is it designed to be used in production.
Developers love tools and already have access to a wide variety of tools. Including Microsoft provided tools like Visual Studio Profiler, Intellitrace, and Application Insights. Plus popular third party tools like LINQPad, Prefix, Retrace, ANTS, and others.
It is an amazing tool for collect deep performance level statistics. I would say it is perhaps a unique tool in its own category. Deep code level details like you would expect from a standard .NET profiler, but only in the scope of a single web request.
It is sort of like Visual Studio Profiler or ANTS but capable of running on a busy server to collect individual transaction traces for review.
This functionality is similar to what most APM solutions aim to provide. Currently, the Service Profiler provides a lot more details, but it also isn’t easy to use.
Our #1 goal with Retrace is to build a service that is very easy to use and is also safe for production. Our presentation of the profiling output is much, much simpler to view and understand (example above about the HTTP call).
Retrace collects key details like log statements, exceptions, SQL queries, cache keys being used, and lots of other little details and packages them up in a really easy to understand format. After the Service Profiler goes GA, we will write up more of a comparison.
Have you tried the Azure Service Profiler? Have any other thoughts or tips about it? Let us know in the comments!
If you would like to be a guest contributor to the Stackify blog please reach out to [email protected]