How to Take Logging to the Next Level With Improved .NET Logging Best Practices
By: Alexandra
| January 16, 2014

Logging. We should be doing this better by now!
What do I mean? There are several logging frameworks and libraries out there, and most developers use one or more of them every day. A few examples off the top of my head for .Net developers are log4net, NLog, elmah, and Serilog. They are simple, easy to use and work great for developers debugging code. However, these tools alone are not enough. In this post, we’ll explore popular issues with log files and share best practices to address those issues, much of which has become a part of Stackify’s log management and error monitoring product.
The Problem With Log Files
Log files are awesome on your local development machine if your application doesn’t have a lot of traffic. Have you ever had to work with your log files once your application left development? If so, you quickly run into a few pain points:
- There’s a lot more data
- You have to get access to the data
- It’s spread across multiple servers
- A specific operation may be spread across service boundaries – so even more logs to dig through
- It’s flat and hard to query – even if you do put it in SQL, you are going to have to do a lot of indexing to make it usable
- You generally don’t have any context of the user, etc
- You probably lack some details that would be helpful (you mean “log.Info(‘In the method’)” isn’t helpful???)
- Log file retention – is the data still there?
- Additionally, you have all this rich data about your app that is being generated and you simply aren’t proactively putting it to work.
How to Take Logging to the Next Level
Once you’re working on an application that is not in the development environment, logging messages (including exceptions) are usually your only lifeline to quickly discovering why something in your app isn’t working correctly. Sure, APM tools can alert you to memory leaks and performance bottlenecks, but lack enough detail to help you solve a specific problem, (why can’t this user login, or why isn’t this record processing?).
At Stackify, we’ve built a “culture of logging” which set out to accomplish these 4 goals:
- Basic logging around everything – For every key transaction in your code you should have some basic logging in your code
- Log contextual data – Logging “something happened” is not enough. You need relevant, contextual logs
- Aggregate logs – Consolidate and aggregate all of our logging to a central location, available to all devs, and easy to distill.
- Proactively use logs – Monitor your logging for errors and key things that are problematic
Log All the Things
I’ve worked in a lot of shops where log messages looked like this:

I’ll give the developer credit: at least they are using a try/catch and handling the exception. The exception will likely have a stack trace so I know where it came from, but no other context. (More on this later)
Sometimes, they even do some proactive logging, like this:

But generally, statements like that don’t go a long way towards letting you know what’s really happening in your app. If you’re tasked with troubleshooting an error in production, and/or is happening for just one (or a subset) of the application users, this doesn’t leave you with a lot to go on, especially when considering your log statement could be a needle in a haystack in an app with lots of use.
As I mentioned earlier, logging is often one of the few lifelines you have in production environments where you can’t physically attach and debug. You want to log as much relevant, contextual data as you can. Here are our guiding principles.
Contextual or Structured Logging
Say you have a critical process that you want to add logging (auditing, really) around so that you can look at what happened. You could just put a try / catch around the entire thing and handle the exceptions (which you should) but it doesn’t tell you much about what went into the request. Take a look at the following, oversimplified example.
Take the following object, which is an Entity Framework Code First POCO object.
public class Foo
{
   public int ID { get; set; }
   public int RequiredInt { get; set; }
   public string FooString { get; set; }
}
Notice that it has a field called RequiredInt which is an int that is, surprisingly, not nullable.
Take the following method, which creates a Foo and saves it to the database. Note how I’ve opened the door for error – the method takes a nullable int as an input parameter. I cast it to type int, but don’t check for null. This could easily cause an exception.
public static void CreateFoos(int? requiredInt, string fooString)
{
   using (var context = new ApplicationDbContext())
   {
      var foo = new Foo();
      foo.RequiredInt = (int) requiredInt;
      foo.FooString = fooString;

      context.Foos.Add(foo);
      context.SaveChanges();

   }
}
It’s an over-simplified scenario, but it serves the purpose well. Assuming this is a really critical aspect of my app (can’t have any failed Foos!) let’s add some logging so we know what’s going on.
try
{
   log.Debug("Creating a foo");

   using (var context = new ApplicationDbContext())
   {
      var foo = new Foo();
      foo.RequiredInt = (int) requiredInt;
      foo.FooString = fooString;

      context.Foos.Add(foo);
      context.SaveChanges();

   }
}
catch (Exception ex)
{
   log.Error(ex);
}
Now, let’s create some foos; one that is valid and one that is not:
CreateFoos(1,"The foo is 1");
CreateFoos(null, "The foo is null");
And now we get some logging, and it looks like this:
DEBUG2014-10-31 13:11:08.9834 [11] Creating a foo [CID:(null)]
DEBUG2014-10-31 13:11:10.8458 [11] Creating a foo [CID:(null)]
ERROR2014-10-31 13:11:10.8673 [11] System.InvalidOperationException: Nullable object must have a value.
at System.ThrowHelper.ThrowInvalidOperationException(ExceptionResource resource)
at System.Nullable`1.get_Value()
at HelloStackify.Web.Controllers.GimmeErrorsController.CreateFoos(Nullable`1 requiredInt, String fooString) in c:GitHubStackifySandbox.NetHelloStackify.WebHelloStackify.WebControllersGimmeErrorsController.cs:line 57 [CID:(null)]
Now we have some logging – we know when Foos are created, and when they fail to create. But I still feel as if I’m missing some context. Context: let’s talk about that. In this example, using log4net, we have a few options. Logging additional data that can be queried later is sometimes called semantic or structured logging.
MORE: What is structured logging and why developers need it
If you look at the signature for the log4net logging methods (log.Debug, log.Info, etc) you’ll see there are a couple of overloaded constructors:
public static void Debug(this ILog log, string message, object debugData)
{
   log.Debug((object) Extensions.GetMessage(message, debugData));
}
See that ‘object debugData?’ Looks like just the ticket, doesn’t it? Let’s change our code to this:
using (var context = new ApplicationDbContext())
{
   var foo = new Foo();
   foo.RequiredInt = (int) requiredInt;
   foo.FooString = fooString;

   log.Debug("Creating a foo: ",foo);

   context.Foos.Add(foo);
   context.SaveChanges();

}
And look at the output of our file logging:
DEBUG2014-11-01 09:26:51.8667 [12] Logging a foo [CID:(null)]
Hmm. How about that….. no object. As it turns out, you need to have an appender that supports serializing that object and outputting it to wherever it logs (in this case, a file appender). So, we have a couple of additional steps to perform.
- Serialize the object ourselves (Json.Net works great for this)
- Create a logging string with a string builder / formatter
log.Debug(string.Format("Creating a foo: {0}",JsonConvert.SerializeObject(foo)));
This will produce some log output that looks like this:
DEBUG2014-11-01 10:39:53.3295 [11] Creating a foo: {"ID":0,"RequiredInt":1,"FooString":"The foo is 1"}
While it serves the purpose, there are some major drawbacks, mainly in that it’s all one string and the more objects and data you add, the more code you are writing. I don’t know about you, but when I’m writing log statements, I want it to be fast and easy. The Stackify appenders support logging objects without needing to do any serialization first. It makes it really easy to log complex dynamic objects such as this:
using (var context = new ApplicationDbContext())
{
   var foo = new Foo();
   foo.RequiredInt = (int) requiredInt;

   context.Foos.Add(foo);
   context.SaveChanges();
   log.Debug("Created a Foo", new { Foo=foo,CreatedBy=User.Identity.Name});
}
Which can yield great output like this:

(This output came from the Stackify Logging Dashboard, via the Stackify log4net appender. More on that later).
Diagnostic Context Logging
And this brings us to one last point: diagnostic context logging. You’ll notice that I logged the user that created the object. When it comes to debugging a production issue, you might have the “Created a Foo” message thousands of times in your logs, but with no clue who the logged in user was that created it. This is the sort of context that is priceless in being able to quickly resolve an issue. Think about what other detail might be useful – for example, HttpWebRequest details. But who wants to have to remember to log it every time? Diagnostic context logging to the rescue. Log4net, for example, makes this really easy. (You can read about the LogicalThreadContext here: http://logging.apache.org/log4net/release/sdk/log4net.LogicalThreadContext.html)
To enable is really easy. In your log4net config, set up your logical thread context variables:
<appender name="StackifyAppender" type="StackifyLib.log4net.StackifyAppender, StackifyLib.log4net">
   <logicalThreadContextKeys>User,Request</logicalThreadContextKeys>
</appender>
Then, just log your context items. In my example, I’m logging data from the User (IPrincipal) and Request (HttpWebRequest) objects. The simplest way to do this is in my Global.asax on each request.
void MvcApplication_AuthenticateRequest(object sender, EventArgs e)
{
   try
   {
      log4net.LogicalThreadContext.Properties["User"] = User;
   }
   catch (Exception ex)
   {
      log.Error(ex);
   }
}   void MvcApplication_BeginRequest(object sender, EventArgs e)
{

   log4net.LogicalThreadContext.Properties["Request"] = new
   {
      HostAddress = Request.UserHostAddress,
      RawUrl = Request.RawUrl,
      QueryString = Request.QueryString,
      FormValues = Request.Form
   };
}
(Note: because I don’t want the entire Request object, I just created a dynamic object with the properties that I care about)
Now, I can simplify my logging statement back to something like this:
log.Debug("Created a Foo", foo);
And get beautiful logging statements output like so:

This brings us to the next topic, which is Work Harder, Not Smarter. But before that, I’m going to address a question I’m sure to hear a lot of in the comments: “But if I log everything won’t that create overhead, unnecessary chatter, and huge log files?” My answer comes in a couple of parts: first, use the logging verbosity levels. you can log.Debug() everything you think you’ll need, and then set your config for production appropriately, i.e. Warning and above only. When you do need the debug info, it’s only changing a config file and not redeploying code. Second, if you’re logging in an async, non-blocking way (such as the Stackify appender), then overhead should be low. Last, if you’re worried about space and log file rotation, there are smarter ways to do it, and we’ll talk about that in the next section.
Work Smarter, Not Harder With Easy to Use Log Searching & Monitoring
Now that we’re logging everything, and it’s great, contextual data, we’re going to look at the next part of the equation. As I’ve mentioned, and demonstrated, just dumping all of this out to flat files (or even SQL for that matter) still doesn’t help you out a lot in a large, complex application and deployment environment. Factor in thousands of requests, files spanning multiple days, weeks, or longer, and across multiple servers, you have to consider how you are going to quickly find the data that you need.
What we all really need is a solution that:
- Aggregates all Log & Exception data to one place
- Makes it available, instantly, to everyone on your team
- Presents a timeline of logging throughout your entire stack / infrastructure
- Is highly indexed, searchable, and “smart” about it
This is the part where I tell you about Stackify log management. As we sought to improve our own abilities to quickly and efficiently work with our log data, we decided to make it a core part of our product (yes, we use Stackify to monitor Stackify) and share with our customers, since we believe it’s an issue central to application performance and troubleshooting. Centralized application logging is critical for every development team to quickly search log messages.
First, we realize that lots of developers already have logging in place, and aren’t going to want to take a lot of time to rip that code out and put new code in. That’s why we’ve created logging appenders for a few of the most common frameworks (detailed information on setup and configuration for all can be found here):
- log4net
- log4j
- nLog
- logback
- Elmah
- Or write directly to our API using our common library, inlcluded with all these appenders or by itself.
Additionally, by using one of these libraries, you also get access to Custom Metrics for .Net and Java which go along great with our App & Server monitoring product.
Continuing with log4net as a sample, the setup is easy. Just add the binaries to the project (you can just dump them in the bin folder and no need to recompile) and add in some web.config-fu:
<log4net>
   <root>
      <level value="ALL" />
      <appender-ref ref="StackifyAppender" />
      <appender-ref ref="LogFileAppender" />
   </root>
<!--Use the following to send only exception and error statements to Stackify -->
   <appender name="StackifyAppender" type="StackifyLib.log4net.StackifyAppender, StackifyLib.log4net">
      <logicalThreadContextKeys>User,Request</logicalThreadContextKeys>
   </appender>
   <appender name="LogFileAppender" type="log4net.Appender.RollingFileAppender">
      <param name="File" value="stackify.log" />
      <param name="AppendToFile" value="true" />
      <rollingStyle value="Size" />
      <maxSizeRollBackups value="10" />
      <maximumFileSize value="10MB" />
      <staticLogFileName value="true" />
      <layout type="log4net.Layout.PatternLayout">
         <param name="ConversionPattern" value="%-5p%d{yyyy-MM-dd HH:mm:ss.ffff} [%thread] %m [CID:%property{clientid}]%n" />
      </layout>
   </appender>
</log4net>
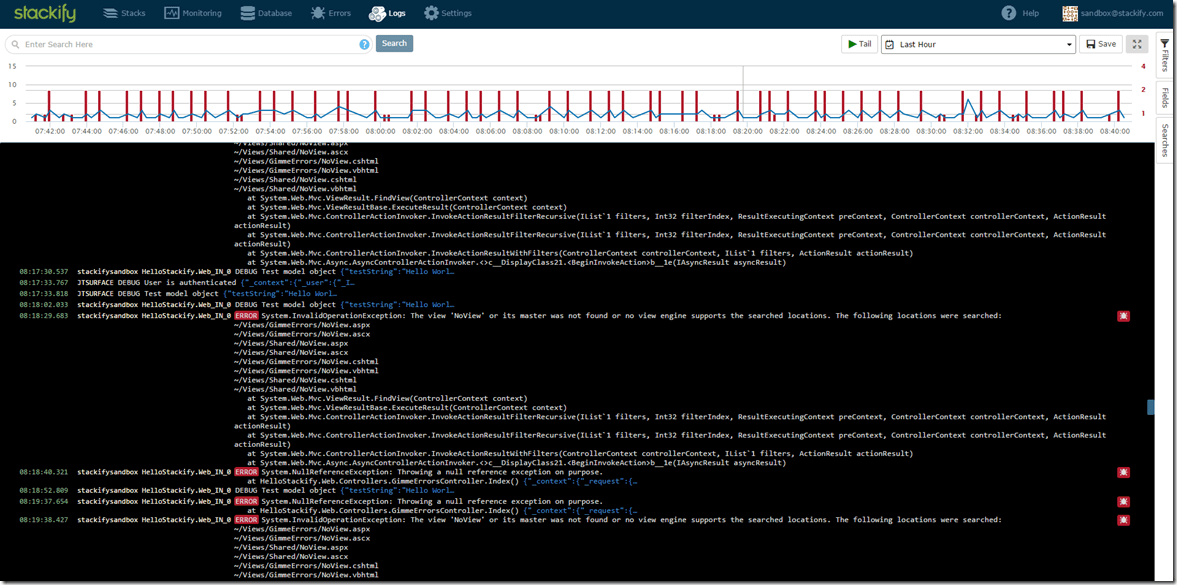
As you can see, if you’re already using an appender, you can keep it in place and put them side-by-side. Now that you’ve got your logs streaming to Stackify (by the way, if our monitoring agent is installed, you can also pipe Windows Event viewer and Syslog files to Stackify as well!) we can take a look at the logging dashboard:

This dashboard shows a consolidated stream of log data, coming from all your servers and apps, presented in a timeline. From here, you can quickly:
- Load logs based on a time range
- Filter for specific server(s) and app(s) or environment(s)
Plus there are a couple of really great usability things built in. One of the first thing you’ll notice is that chart at the top. It’s a great way to quickly “triage” your application. The blue line indicates the rate of log messages, and the red bars indicate # of exceptions in the log detail. In the screenshot above, the rate of both looks pretty steady, but if I zoom this chart out to the last 7 days it looks like this:

It’s abundantly clear that a couple of days ago, my web app started having a lot more activity (as shown by the logging level – Stackify monitoring would corroborate this data as it parses and analyzes traffic via web server logs) but more importantly, we started getting a lot more exceptions about the same time. Exceptions don’t come without overhead for your CPU and Memory, and they also can have a direct impact on user satisfaction, which can easily cost real money.
By zooming in on the chart, to this time period, I can quickly filter my log detail down to that time range and take a look at the my logs for that time range.

A couple of interesting things to point out here:
Log Searching
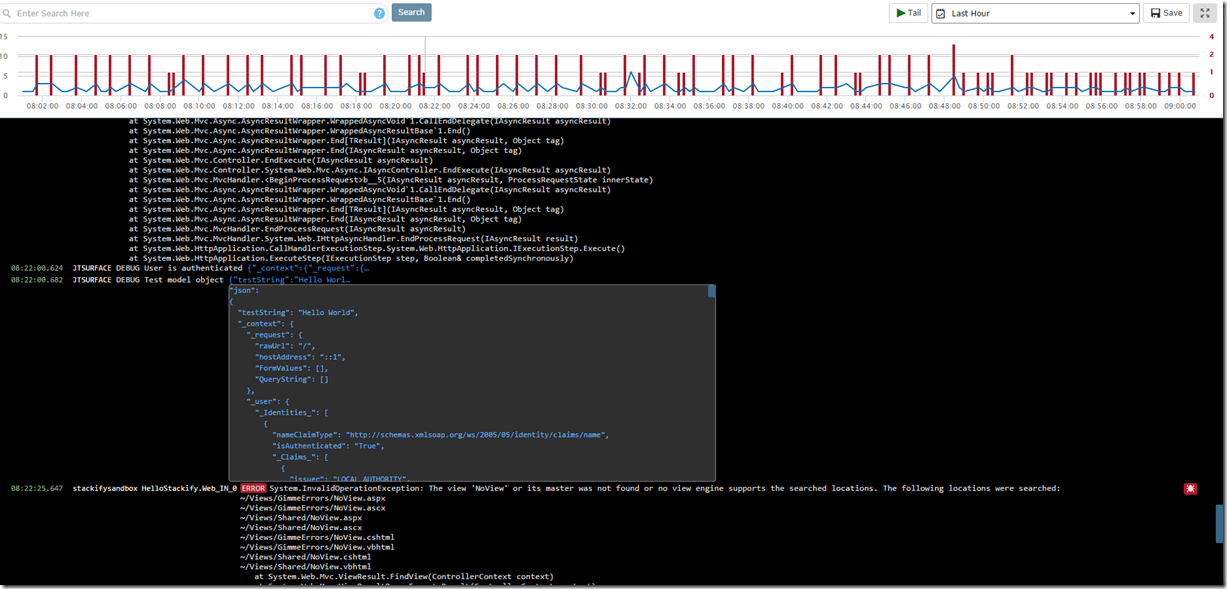
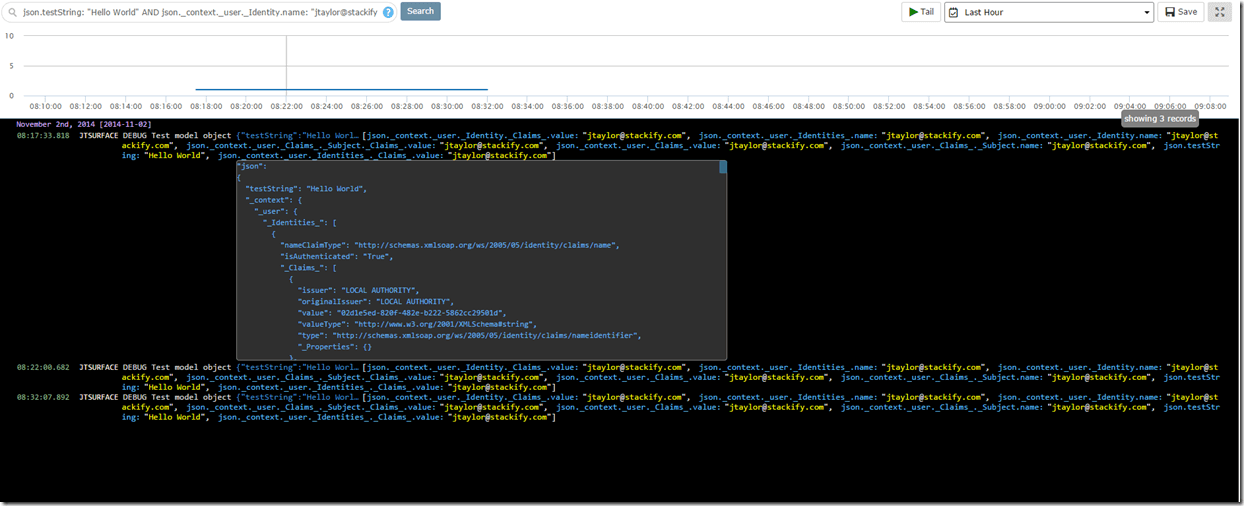
See that blue text, that looks like a json object? Well, it is a json object. That’s the result of logging objects, and adding context properties (also objects) earlier. It looks a lot nicer than plain text in a flat file, doesn’t it? Well, it gets even more awesome. See the search box at the top of the page? I can put in any search string that I can think of, and it will query all my logs as if it were a flat file. As we discussed earlier, however, this isn’t great because you could end up with a lot more matches than you want. Suppose that I want to search for “Hello World” but only in the context of a property called “testString?”
Fortunately, our log aggregator is smart enough to help in this situation. That’s because when we find serialized objects in logs, we index each and every field we find. That makes it easy to perform a search like this:
json.testString: “Hello World”
and get just the values that I’m looking for. But I can dig deeper. Say I want to look just for that statement and filter by a specific user (remember, we added the logged in user to every statement via the LogicalThreadContext):
json.testString: “Hello World” AND json._context._user._Identity.name: [email protected]
That yields the following results, with the search strings / objects specifically highlighted.

Want to know what else you can search by? Just click on the document icon  when you hover over a log record, and you’ll see all the fields that Stackify indexes. (Note: at the time of this writing, we are preparing to release a new search UI that will provide a dynamic list of filters that you can one-click apply without having to know any query syntax.)
Exceptions
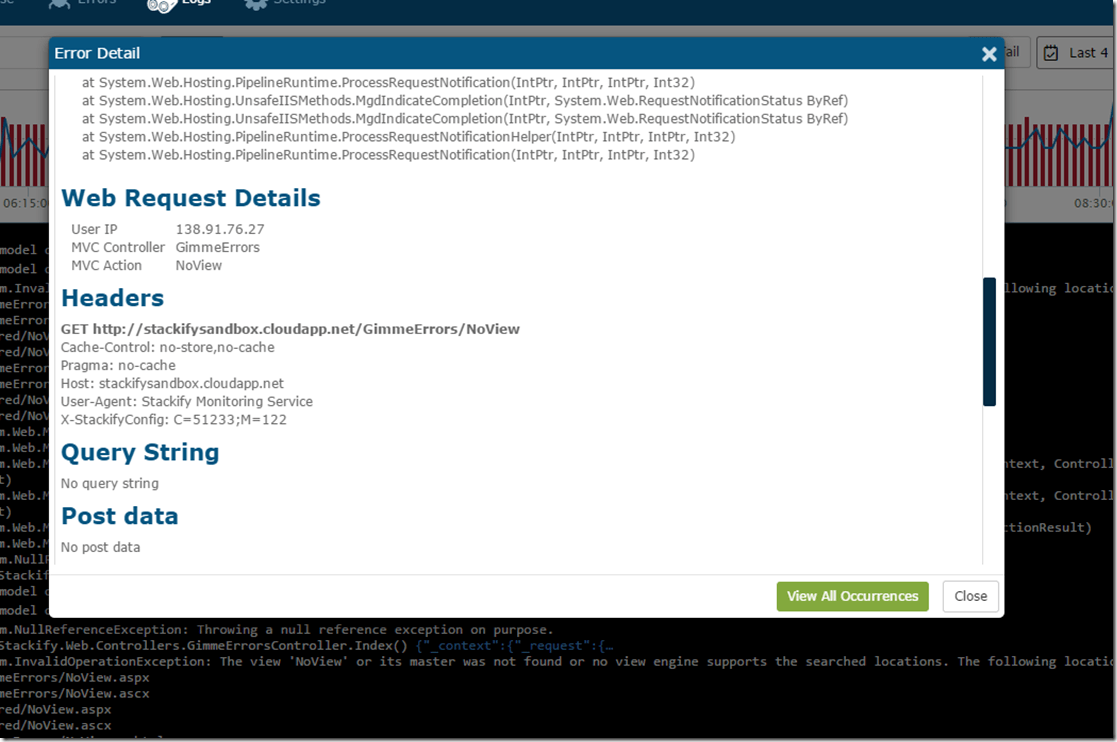
You may have also noticed this little red bug icon  next to exception messages. That’s because we treat exceptions a bit differently. Click on it and we present a deeper view of that exception. ASP.NET exception logging is much more useful when you can see all of the web request details.

Our libraries not only grab the full stack trace, but all of the web request details, including headers, querystrings, post data, and server variables. In this modal, there is a “Logs” tab which gives you a pre-filtered view of the logging from the app that threw the error, on the server where it occurred, for a narrow time window before and after the exception, to give more context around the exception. Curious about how common or frequent this error occurs, or want to see details on other occurrences? Click the “View All Occurrences” button and voila!

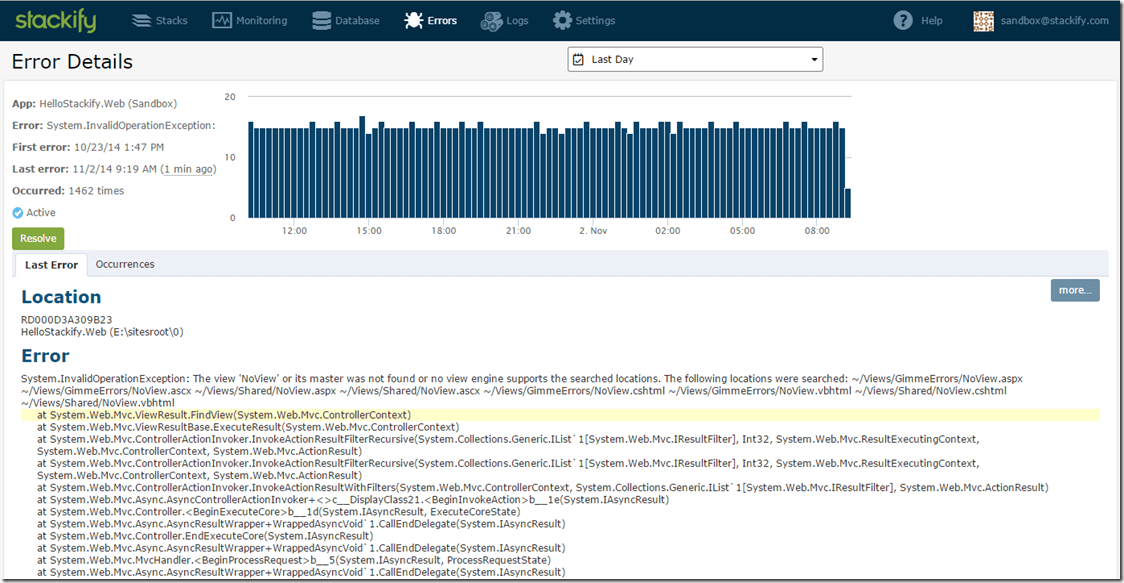
I can quickly see this error has occurred 1462 times over the last day, and at a pretty steady rate. It tells me, as a developer, that I have a pretty persistent bug.
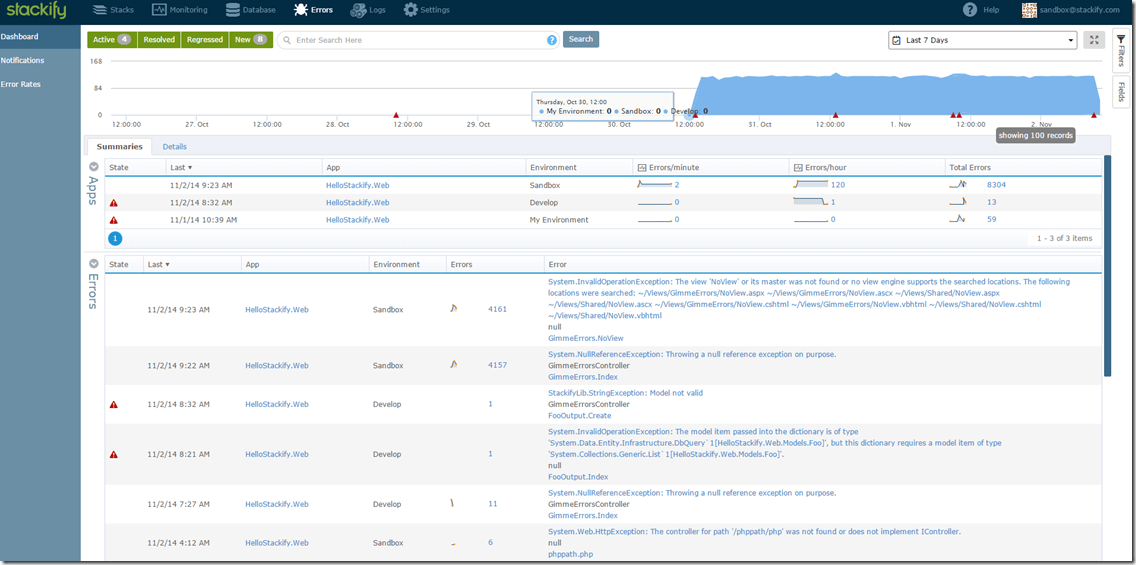
Errors and Logs are closely related, and in an app where a tremendous amount of logging can occur, exceptions could sometimes get a bit lost. That’s why we’ve built an Errors Dashboard as well, to give you this same consolidated view but limited to exceptions.

Here I can see a couple of great pieces of data:
- I’ve had a big uptick in my rate of exceptions over the past couple of days
- The majority of my errors are coming from my “Sandbox” environment – to the tune of about 120 per hour
- I have a couple of new errors that have just started occurring (as indicated by the red triangles)
Have you ever put a new release of your app out to production and wondered what QA missed? (Not that I’m saying QA would ever miss a bug……) Error Dashboard to the rescue. You can watch real time and see a trend – lots of red triangles, lots of new bugs. Big spike in the graph? Perhaps you have an increase in usage, so a previously known error is being hit more; or perhaps some buggy code (like a leaking SQL connection pool) went out and is causing a higher rate of SQL timeout errors than normal.
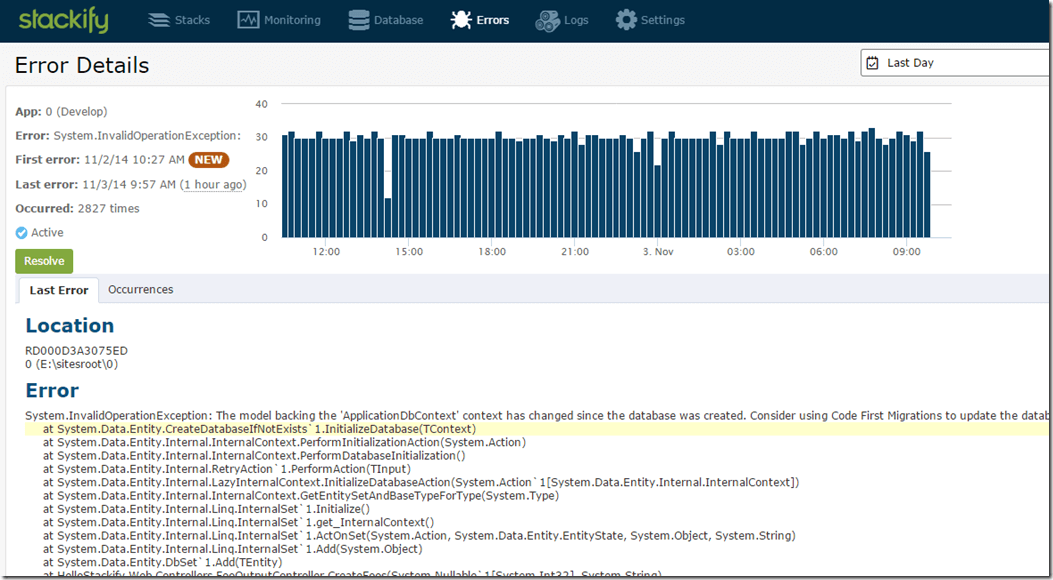
In fact, as I was writing this article, I published a change to the app I’m using, and forgot to first publish the EF Code First migrations (and did not have automatic migrations turned on). This scenario is exactly what I’m referring to. Front and center on my dashboard, I see A new error around this, and it’s happening a lot.

It’s not hard to imagine a lot of different scenarios to which this could provide early warning and detection for. Hmm. Early warning and detection. That brings up another great topic.
Error & Log Monitoring
Wouldn’t it be nice to be alerted when:
- An error rate for a specific app or environment suddenly increases?
- An error that was specifically resolved starts happening again?
- A certain action that you log does not happen enough, too often, etc?
Stackify can do all of that. Let’s take a look at each.
Error Rates
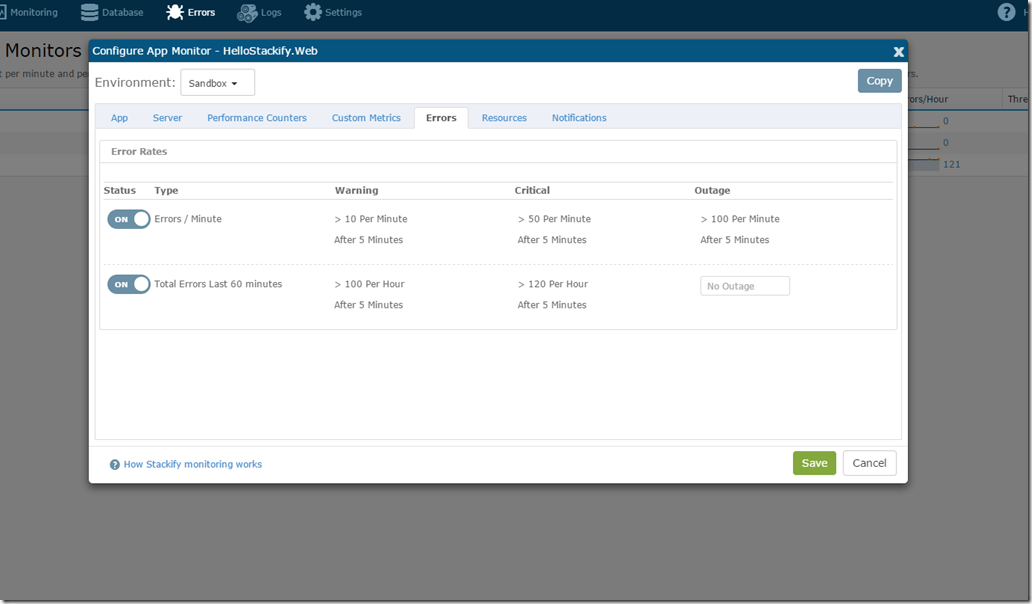
When we looked at the error dashboard, I noted that my ‘Sandbox’ environment is getting a high number of errors per hour. From the Error dashboard, click on “Error Rates” and then select which app / environment you wish to configure alerts for:

I can configure monitors for “Errors / Minute” and “Total Errors Last 60 minutes” and then choose the “Notifications” tab to specify who should be alerted, and how. Subsequently, if using Stackify Monitoring, I can configure all of my other alerting here as well: App running state, memory usage, performance counters, custom metrics, ping checks, and more.
Resolved Errors & New Errors
Earlier on, I introduced a new error by not publishing my Code First migrations when I deployed my app. I’ve since fixed that and confirmed it by looking at the details for that particular error. As you can see, the last time it happened was 45 minutes ago:

It was a silly mistake to make, but one that is easy to make as well since I don’t have automatic migrations enabled. I’m going to mark this one as “resolved” which lets me do something really cool: get an alert if it comes back. The Notifications menu will let me check my configuration, and by Default I’m set to receive both new and regressed error notifications for all my apps and environments.

Now, if the same error occurs again in the future, I’m going to get an email about the regression and it shows up on the dashboard as such. This is great little bit of automation to help out when you “think” you’ve solved the issue and want to make sure.
Log Query Monitors
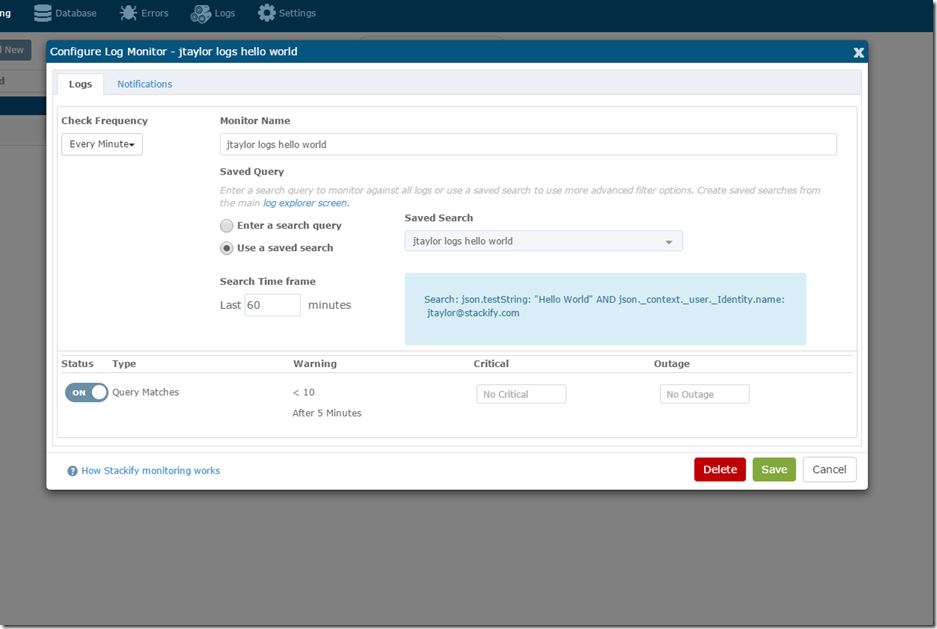
Some things aren’t very straightforward to monitor. Perhaps you have a critical process that runs asynchronously and the only record of it’s success (or failure) is logging statements. Earlier in this post, I showed the ability to run deep queries against your log data, and any of those queries can be saved, and monitored. I’ve got a very simple scenario here: my query is executed every minute, and we can monitor how many matched records we have.

It’s just a great simple way to check system health if a log file is your only indication. (Here’s a pro-tip: send your Windows Event Logs to Stackify and monitor for W3WP process crashes and other stack overflow type events).
.NET Logging Best Practices
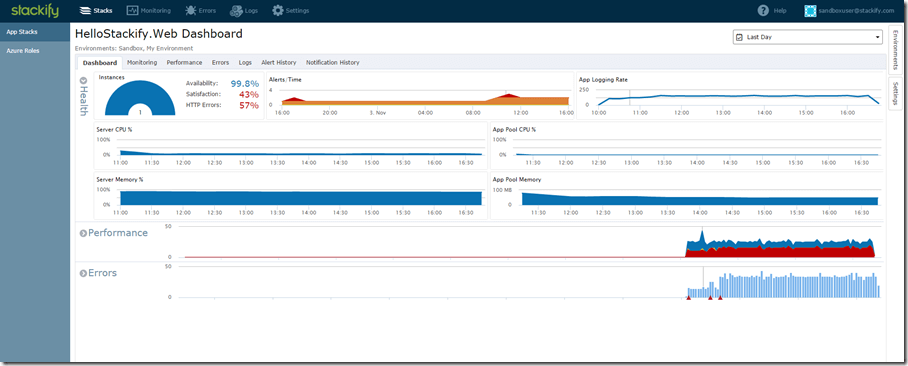
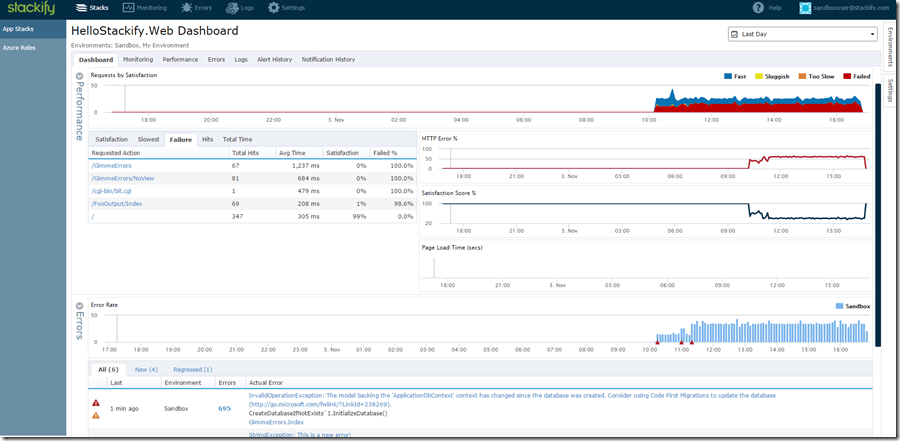
All of this error and log data can be invaluable, especially when you take a step back and look at a slightly larger picture. Below is the Application Dashboard for this app that contains all of the monitoring:

As you can see, you get some great contextual data at a glance that errors and logs contribute to: Availability, Satisfaction, and Errors. The site is up (99.8%) but the user satisfaction is low and errors are high. You can quickly start drilling down to see which pages are not performing well, and what errors are occurring:

And when looking at a specific error, see the associated logs. All said and done, this has helped us tremendously in improving our own product, to quickly detect and resolve application issues.
There was a lot to cover in this post, and I feel like I barely scratched the surface. If you dig a little deeper, or even get your hands on it, you can! I hope that these C# logging best practices will help you write better logs and save time troubleshooting. I’ve made the sample app available here on GitHub and sign up for a free trial to get started with Stackify today!
Also check out our article about log tagging, and ASP.NET Core logging.
Improve Your Code with Retrace APM
Stackify's APM tools are used by thousands of .NET, Java, PHP, Node.js, Python, & Ruby developers all over the world.
Explore Retrace's product features to learn more.
Learn More
