
Picture this: you’re standing in the largest meeting room in your company. Behind you, a huge LED monitor. In front of you, all members of the C-suite. The CTO, your direct boss, is visibly nervous. The CEO looks interested and somewhat excited. The CFO looks happier than usual, though it probably has more to do with his very successful golf round the day before and nothing to do with the presentation you’re about to give.
When everyone gets there and you’re all set up, the presentation begins. You open Chrome and paste the URL for the test environment into the address bar. You hit enter and boom! The 2.0 version of your web application appears in all its glory.
You start clicking around and showing some features, but it doesn’t take too long for things to go sour. The issue is neither the looks of the application nor its usability. On the contrary: the app is gorgeous, with a clean look. It has vibrant but not excessive colors, and it employs elegant and readable fonts. The interface is intuitive and easy to use.
So, what’s the matter? Performance. Some of the features are excruciatingly slow. You start stuttering and sweating profusely. The executives aren’t happy. You’re relieved when you can bring the presentation to an end.
After some investigation, it turns out the problem was good old SQL—not vanilla, manually-crafted SQL, but queries automatically generated by Entity Framework.
In order to avoid such a situation from happening again, you should employ the quality assurance technique at your disposal, including but not limited to, extensive testing. But life isn’t always a bed of roses. Even by employing development best practices and after doing a lot of testing, it isn’t guaranteed that the application will perform the way it should. Sometimes things go wrong despite your efforts.
If and when you find yourself in a situation like the one above, there is a category of tools that might come in handy: a profiler. More specifically, an Entity Framework profiler. It’s even better if it’s free, right?
That’s exactly what today’s post is about. I’m going to show you a free and easy to use Entity Framework profiler you can start using today. We’re going to begin by creating a demo application to profile.
At the end of this article, you’ll have a working ASP.NET MVC application that you’ll be able to profile using Stackify Prefix. Let’s get started.
For this post, I won’t just assume you’re familiar with Entity Framework. Those of you who are, feel free to skip this section entirely. Entity Framework is an ORM tool released by Microsoft in 2008. It was originally a part of the .NET Framework, but nowadays it’s a separate open-source project. But wait, what’s an ORM?
ORM stands for object-relational mapping. It’s a technique for bridging two very different worlds: objects in an object-oriented language, and tables in a relational database system.
The ORM is usually responsible for the following steps:
An ORM can, most of the time, successfully create the illusion that there’s no database at all. From the developer’s point of view, they’re only dealing with ordinary objects.
And that’s a good and valuable thing. This layer of abstraction frees developers from having to manually write SQL code. They can then spend this time working on more high-level concerns.
Not everything is a bed of roses, though. It’s possible for developers to misuse the ORM in such a way that the resulting queries aren’t that great. It’s also possible that the ORM itself didn’t do a great job at generating the query. Yet another possibility: maybe both the developer and EF did their jobs correctly, but the database table lacks an index, which makes a selection perform way worse than it should.
Performance matters. When performance problems arise, there’s really no way around profiling. So, how to go about that?
Prefix is a free tool from Stackify that performs live, automatic, and easy profiling for your application. In this section, we’ll walk you through a simple tutorial on how to install it and put it to use. Let’s get started.
Let’s begin by creating a demo application. It’s going to be an extremely simple web app, with a single model and a single controller. Fire up Visual Studio 2017, go to “File,” “New,” and then “Project…”
In the opened window, on the left panel under Visual C#, click “Web.” On the center panel, choose “ASP.NET Web Application (.NET Framework).” Then provide a name and location for the app, just like in the following image:
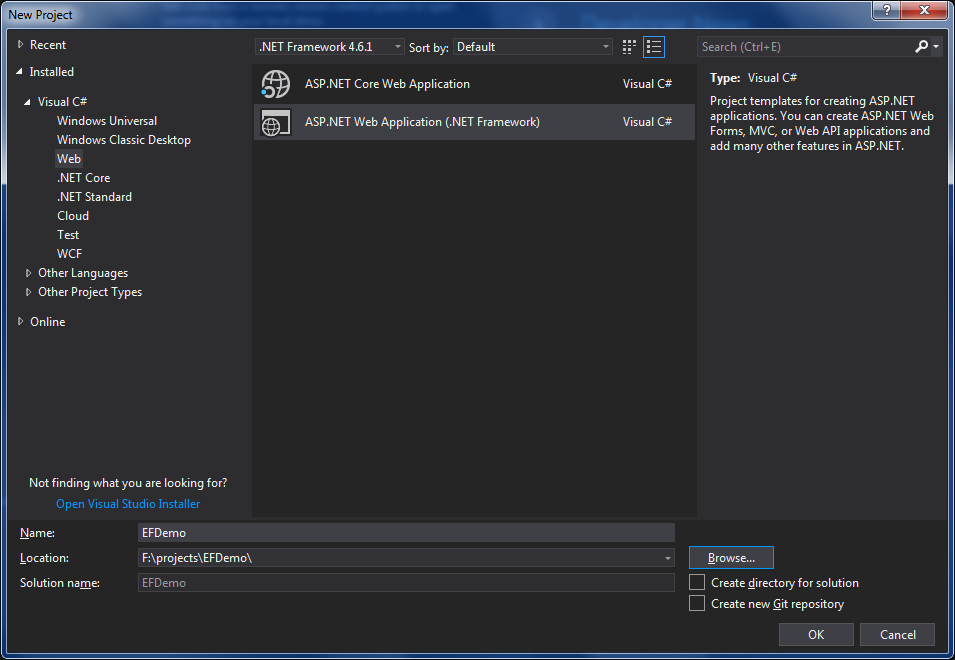
Finally, click OK. After that, you’ll see the following window:
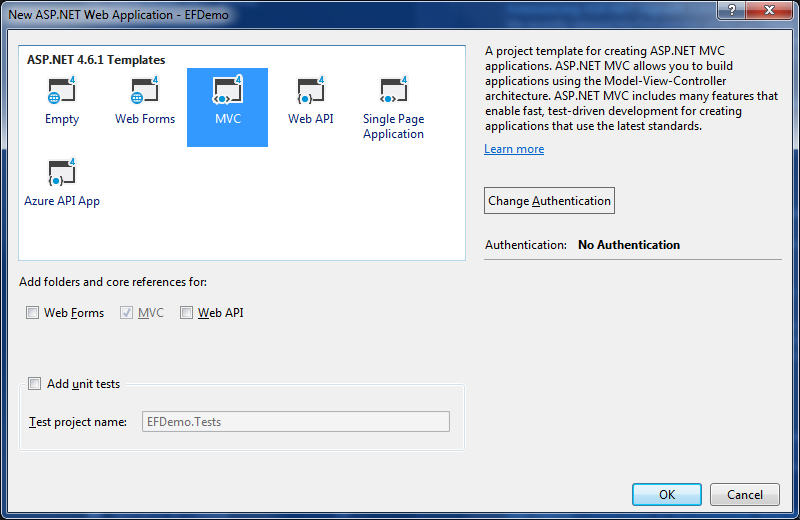
Select the “MVC” template, just like in the image, and click OK. After that, the solution will be created and opened for you on Visual Studio. We’re now ready to start adding code to it.
On the “Solution Explorer” window, right-click the “Models” folder, and then “Add -> Class”:
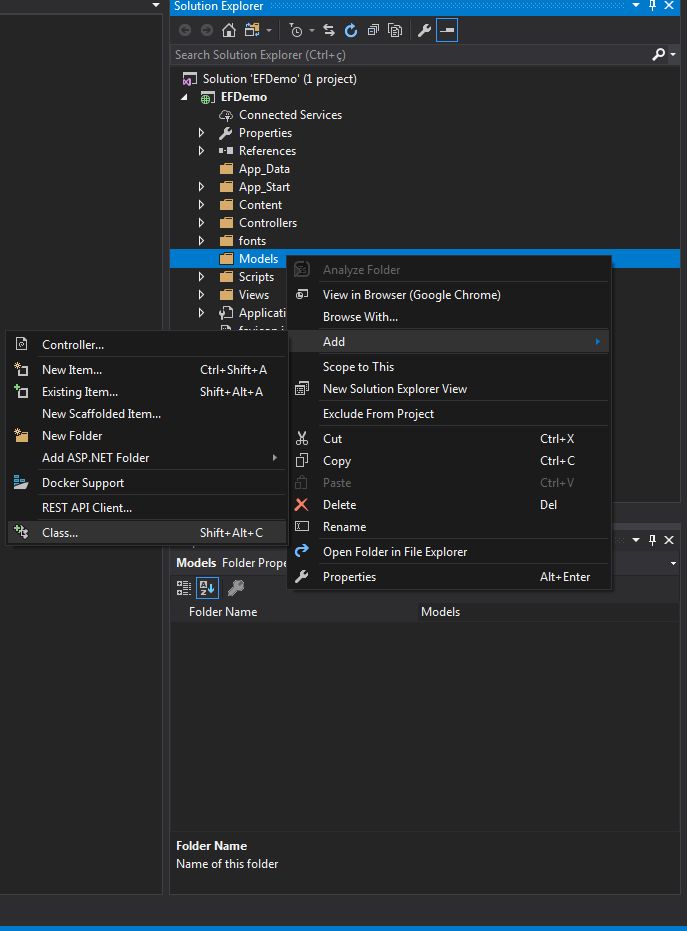
In the opened window, inform “Book” as the name of the class and then hit the “Add” button. The class will be created and left opened, waiting for your edits. And edit it we will! Replace all of the file’s content with the code below:
namespace EFDemo.Models
{
    public class Book
    {
        public int Id { get; set; }
        public string Title { get; set; }
        public string Isbn { get; set; }
        public string Author { get; set; }
    }
}
With our model in place, we’re ready to create a controller. Right-click the “Controllers” folder, go to “Add,” “New,” and “New Scaffolded Item…” After doing this, you should see a screen like the following one:
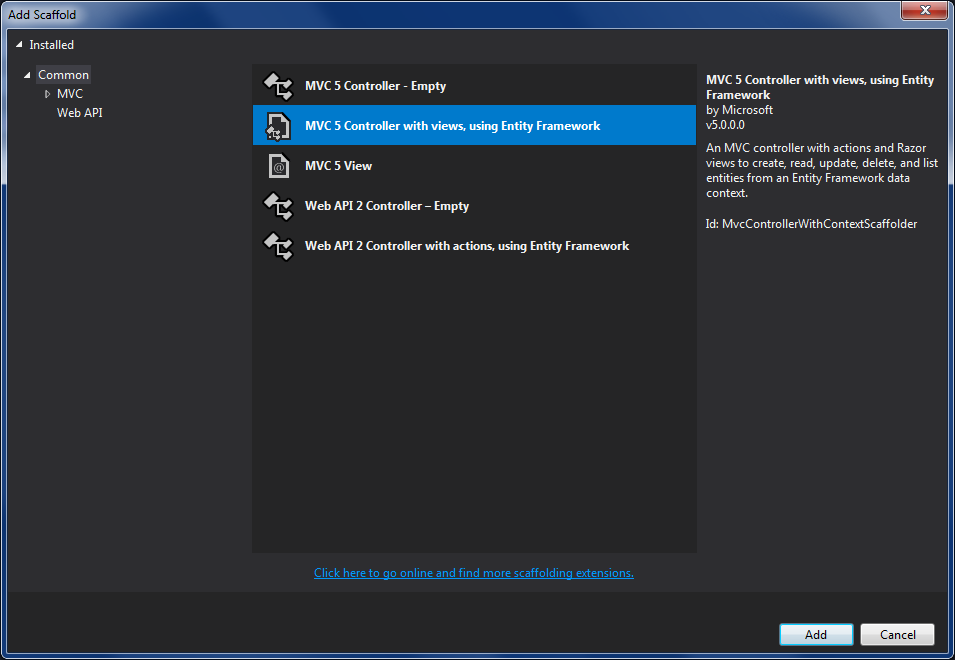
Select “MVC 5 Controller with views, using Entity Framework” and click “Add.” After that, you should see the following window:
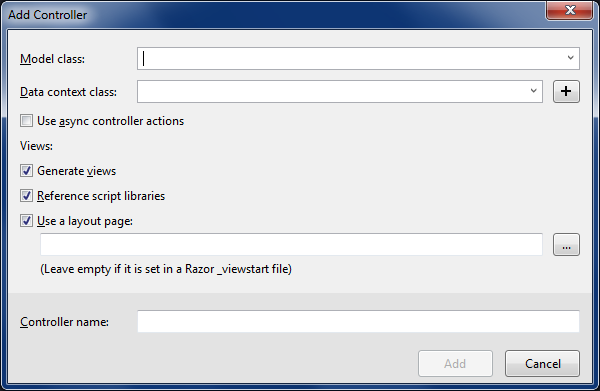
Start by choosing our newly created “Book” class as the model. As for the data context class, you can’t pick one because none exists. Click the “+” button to create it. You’ll be prompted for a name. Pick one (or leave the default as it is), click “Add,” and you’re done.
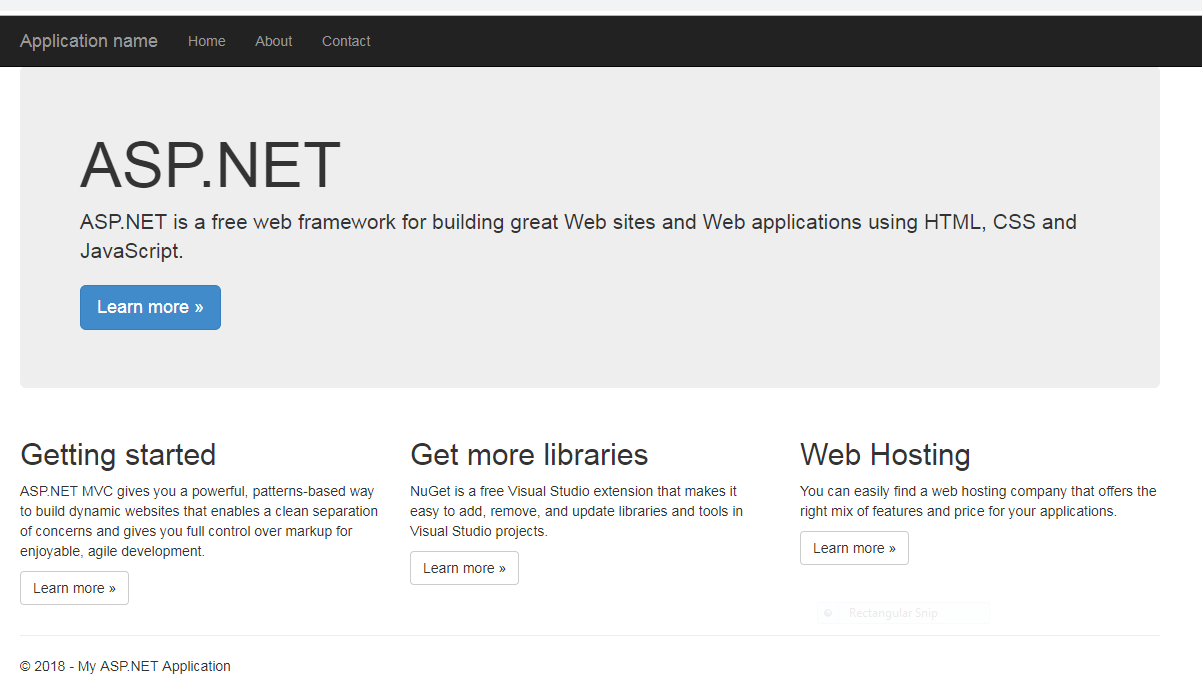
All of the remaining options can be left the way they are. Finally, click “Add,” and the “BooksController” class will be created and opened for you. Now hit F5 and, if everything went well, you should see a screen like the one below:
Finally, append “/Books” to the address, hit enter, and this is what you’ll see:
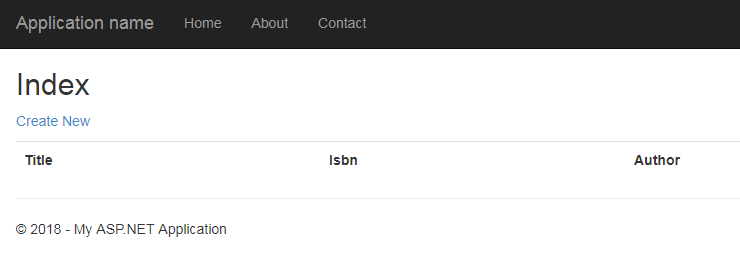
If you click the “Create New” link, you’ll be taken to a screen where you’ll be able to add the first book to our store. If you have a few minutes, spend some of them creating and editing a couple records if you can. That’s going to come in handy in the next section.
Time to start profiling our app! Go to https://stackify.com/prefix, type in your email address, and then click the download button. The download should start immediately. After you complete the download, double-click the installer and installation will begin as normal.
Alternatively, you can install Prefix using Chocolatey:
> choco install Prefix
If Prefix is correctly installed, it’ll open a new tab on your browser and show you something like this:
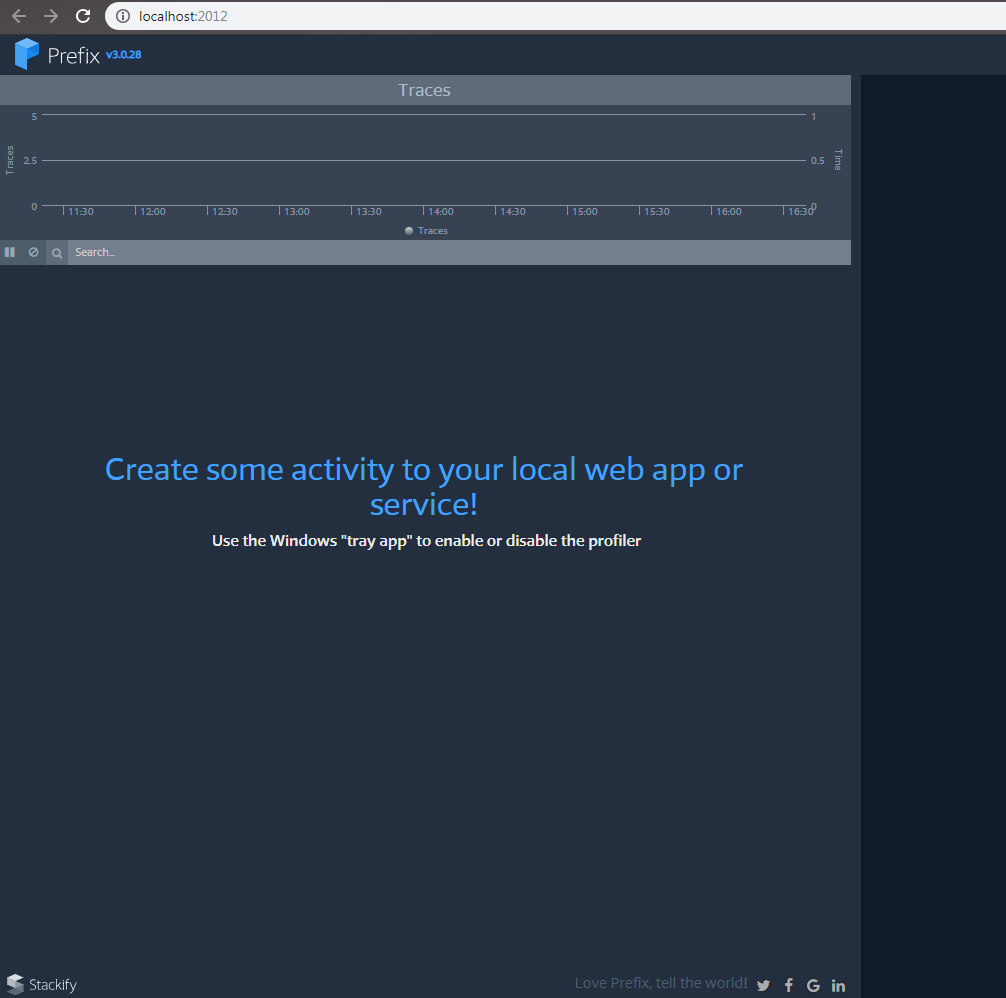
If you see the above screen, then Prefix is up and running and you can use the app in the Windows system tray to enable or disable the profiler:
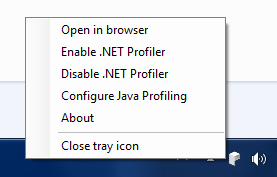
Click on “Enable .NET Profiler.” Then, click on “Yes” when it asks you whether you really want to enable the profiler. And that’s it. Profiler enabled! If you go to the tab in your browser, you might see a message saying that, in order for the profile to work correctly, you must restart Visual Studio.
Restart Visual Studio, press F5 to start debugging our web app again, and access the “/Books” route. Now things start to get interesting:
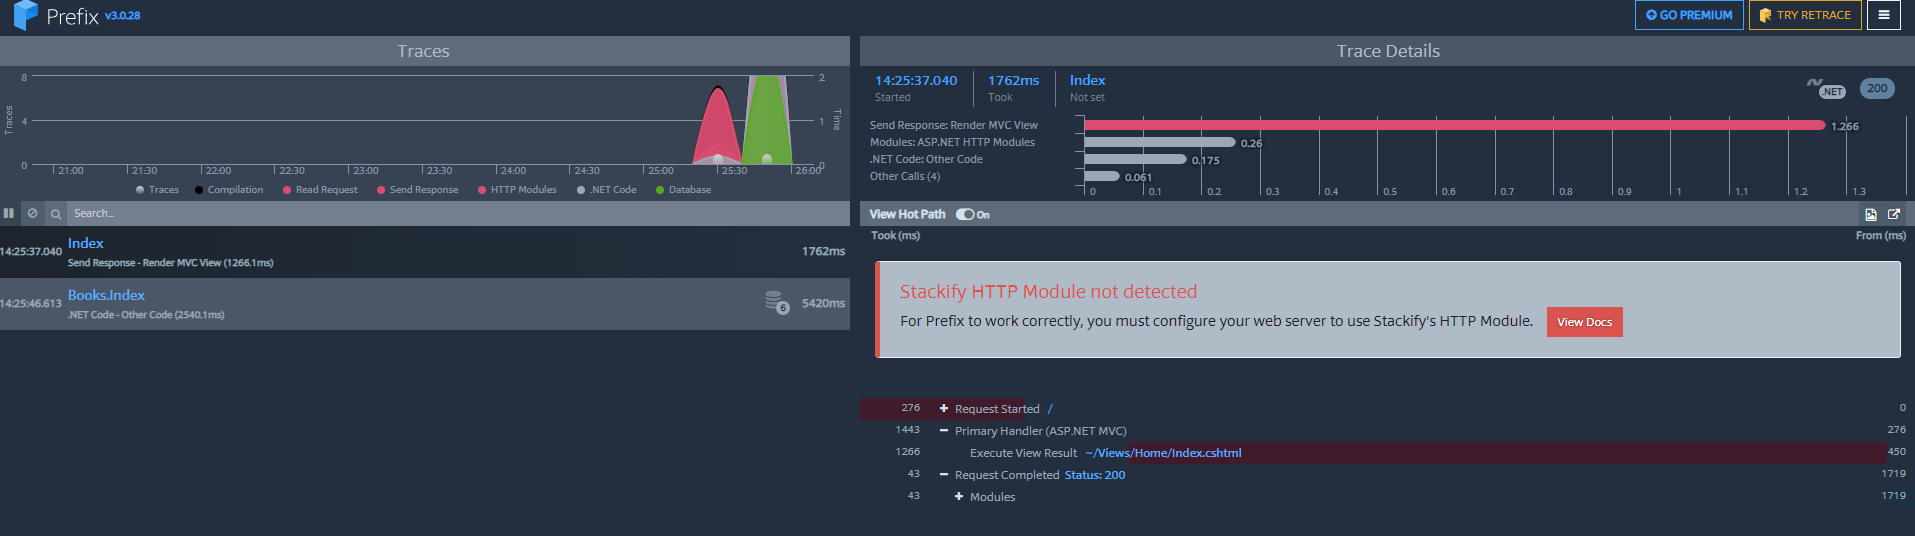
On the left panel, we can already see useful data. For instance, just that request (“/Books”) generated six calls to the database. We can then click the request to expand its details:
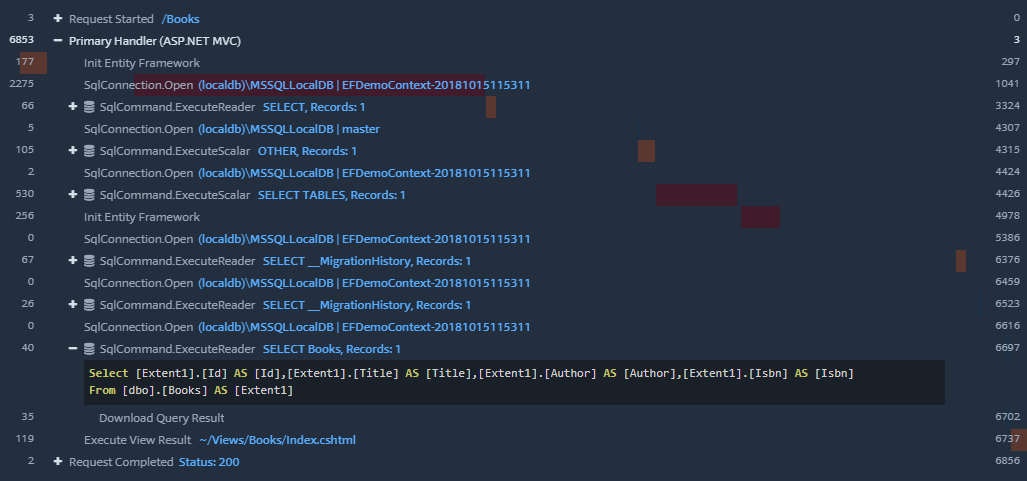
At a glance, we can see:
And that’s just a tease of all that Prefix can do for you.
The story I told at the beginning of the post is just a fictional story, of course. But if you’ve been a developer for at least a few years, I’m sure you have real stories to tell that aren’t very different. Performance issues are real, and they matter. Your app might be beautiful, with an intuitive interface. It might even work correctly. But if the performance is terrible, none of that matters.
Fortunately, there are tools at our disposal. Today’s post covered one of them: Stackify Prefix. Download it and give it a try today, and harvest the benefits of using an amazing application profiler.


Stackify's APM tools are used by thousands of .NET, Java, PHP, Node.js, Python, & Ruby developers all over the world.
Explore Retrace's product features to learn more.


