
Syslog is a standard for sending and receiving notification messages–in a particular format–from various network devices. The messages include time stamps, event messages, severity, host IP addresses, diagnostics and more.
In terms of its built-in severity level, it can communicate a range between level 0, an Emergency, level 5, a Warning, System Unstable, critical and level 6 and 7 which are Informational and Debugging.
Moreover, Syslog is open-ended. Syslog was designed to monitor network devices and systems to send out notification messages if there are any issues their functionality–it also sends out alerts for pre-defined events and monitors suspicious activity via the change log/event log of participating network devices.
The Syslog protocol was initially written by Eric Allman and is defined in RFC 3164. The messages are sent across IP networks to the event message collectors or syslog servers. Syslog uses the User Datagram Protocol (UDP), port 514, to communicate. Although, syslog servers do not send back an acknowledgment of receipt of the messages. Since 2009, syslog has been standardized by the IETF in RFC 5424.

Screenshot via Flylib
Today, it has gained wide support on many operating systems including almost all versions of Linux, Unix, and MacOS. For Microsoft Windows, Syslog is supported through open sources and commercial third-party libraries.
In the simplest definition, logging is the act of keeping a log. Sysadmins have engaged in an ongoing debate over what level of detail to log their system data. There is the tradeoff between using up disk space too quickly and not having enough data in your logs.
Yet, the benefits of logging are still wide-ranging—especially when troubleshooting code. It is necessary to have a standardized and centralized system to generate, record and log messages.
Furthermore, it helps to improve your ability to control and use logging data. Here are a few other benefits:
Without logging, it can become a nightmare to search for a single transaction that may have been processed on any of your servers.
With centralized logging, you get a correlated view of all of the log data. In contrast, reviewing each log file separately can become quite time-consuming. This is why using Syslog to forward local log messages to a remote log analytics server has become the standard for logging solutions.
You now understand how Syslog offers a central repository for logs from multiple sources. To achieve this objective, Syslog servers have several components including:
To illustrate, it can extract messages based on specific parameters such as a critical event or device name. You can also use the filter to avoid seeing certain types of entries through the Negative Filter rule. If you wanted, you could show all of the critical log messages from a firewall.

There are three different layers within the Syslog standard, which are:
(Image via Wikimedia Commons)
In addition, applications can be configured to send messages to several destinations. There are also alarms that give instant notifications for events such as:
Furthermore, alarms can be set up to send notifications via SMS, pop-up messages, email, HTTP and more. Since the process is automated, the IT team will get immediate notifications of there is a sudden failure of any of the devices.
Syslog servers are used to send diagnostic and monitoring data. The data can then be analyzed for system monitoring, network maintenance and more. Since the Syslog protocol is supported by a wide swath of devices, they can conveniently log information into the Syslog server.

SNMP data can be used to assess any failure points quickly. Syslog servers can also have automated events to trigger alerts that help to prevent downtime or outages.
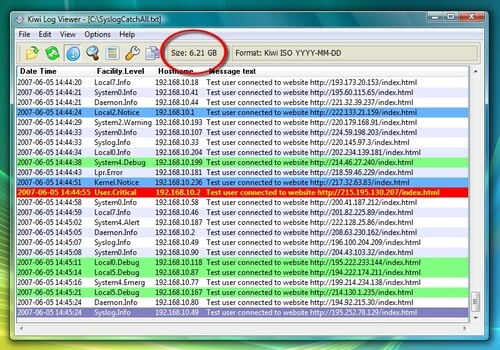
1. Kiwi Syslog Server. This server is simple to install and generates reports in plain text or HTML. The software handles Syslog and SNMP, even from Linux and UNIX hosts. It is compatible with Windows 10 (32/64-bit), Windows 11 (32/64-bit), Windows Server 2016, Windows Server 2019, Windows Server 2022, Windows Server 2022 R2, Windows 8, Windows Server 2012 & 2012 R2.
2. PRTG. This adds a sensor to the PRTG monitoring to enable Syslog ability. It focuses on SNMP and Syslog protocol data. It is compatible with any Windows 64-bit environment, including Windows Server 2016, Windows Server 2019, Windows Server 2022, and Windows 11.
3. SNMPSoft Sys-log Watcher. This is a dedicated syslog server for a wide variety of devices. It can also parse and manage non-standard Syslog. It is compatible with Windows 10, Windows 11, and Windows Server 2016, 2019, and 2022.
4. The Dude. This system is used for general network management with a built-in syslog server. Furthermore, it comes with functionality for remote logging through the RouterOS. It is compatible with Windows 10, Windows 11, and Windows Server 2016, 2019, and 2022. It also runs on Linux or macOS using Wine/Darwine.
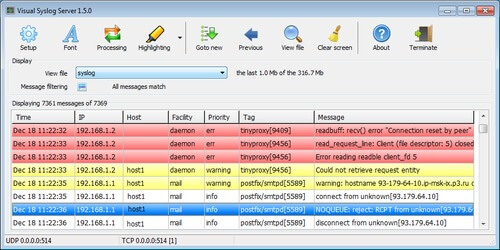
5. Visual Syslog Server. This is a lighter syslog option that looks at alerts in real-time. Thresholds can be configured to trigger both scripts and programs. It is compatible with Windows XP, Vista, 7, 8, 8.1, as well as Windows Server 2003, 2008, 2012.
Visual Syslog does not explicitly list the latest Windows Server 2022 and Windows 11 as supported operating systems. However, many applications that support Windows Server 2016 and 2019 may also work on Windows Server 2022 due to compatibility features in the Windows operating system.
For the Mac OS X, you can use Splunk–which enables system monitoring and syslog events. In fact, Splunk is known as the tool for operational intelligence. Also, you can configure Splunk as a forwarder to your central monitoring server.
To configure the Mac OS X Syslogd you would:
1. Open a terminal window
2. Make a backup copy of syslogd.conf into the /tmp folder by typing
$ cp /etc/syslog.conf /tmp/syslog.conf.bkp3. Open the configuration file in the editor of your choice
$ sudo vi /etc/syslog.confPassword: The ‘sudo’ command is used to execute vi with “root” privileges.
4. Replace the IP address 192.168.1.12 with the IP address if your Splunk server’s network interface
5. Type ‘i’ in vi to enter the insert mode (text entry). Make sure to use tabs and not spaces between the selector and action fields.
6. Save and Exit. Save the file by typing
’:wq <enter>’7 Restart the ‘syslogd’ service, and test it by typing
$ ps -e | grep syslogd

5070 ?? 2:33.75 /usr/sbin/syslogd
These are the commands that restart the service:
$ sudo launchctl unload /System/Library/LaunchDaemons/com.apple.syslogd.plist

$ sudo launchctl load /System/Library/LaunchDaemons/com.apple.syslogd.plist
To log an event, open a new Terminal window and type:
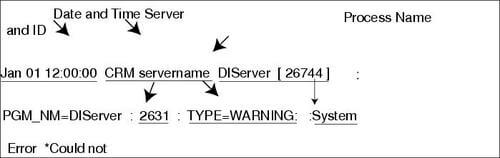
$ logger -s -p user.info "Testing splunk syslog forwarding"Syslog has a standard definition and format of the log message defined by RFC 5424. As a result, it is composed of a header, structured-data (SD) and a message. Within the header, you will see a description of the type such as:
Then, you will see structured-data which have data blocks in the “key=value” format within square brackets. After the SD, you will see the detailed log message, which is encoded in UTF-8.
For example, the following message:
<34>1 2003-10-11T22:14:15.003Z mymachine.example.com su - ID47 - BOM'su root' failed for lonvick on /dev/pts/8Corresponds to the following format:
<priority>VERSION ISOTIMESTAMP HOSTNAME APPLICATION PID MESSAGEID STRUCTURED-DATA MSGSyslog messages are used to report levels of Emergency and Warnings with regards to software or hardware issues.

To illustrate, a system restart will be sent through the Notice level. A system reload will be sent through the Informational level. If debug commands are outputted, it is conveyed through the Debug level.
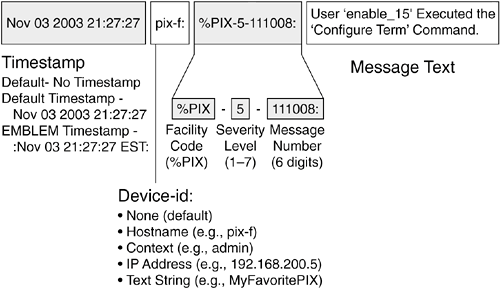
Screenshot via Cisco
Here are the Syslog Message Levels:
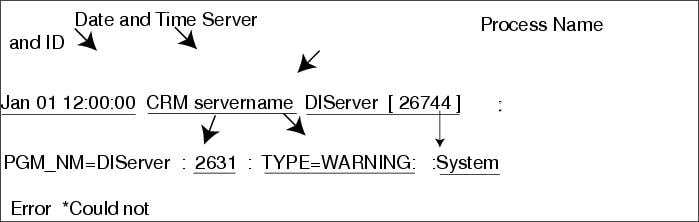
Here are some additional examples from TechZone.
This system error message:
May 11 10:40:48 scrooge disk-health-nurse[26783]: [ID 702911 user.error] m:SY-mon-full-500 c:H : partition health measures for /var did not suffice - still using 96% of partition spaceWe can split into the following columns:
Column 1 = "May 11 10:40:48" > Timestamp
Column 2 = "scrooge" > Loghost
Column 3 = "disk-health-nurse[26783]:" > Application/Process
Column 4 = "[ID 702911 user.error]" > Syslog facility.level
Column 5 = "m:SY-mon-full-500" > Message ID
Column 6 = "c:H : partition health..." > Message [possibly including rid, sid, ip]
And, here’s an example of a summary message:
May 11 10:00:39 scrooge SG_child[808]: [ID 748625 user.info] m:WR-SG-SUMMARY c:X vhost:iscrooge61.seclutions.com:80 (http) GET / => http://bali/ , status:200 , redirection URL:<n/a> , referer:<n/a> , mapping:bali , request size: 421 , backend response size: 12960 , audit token:- , time statistics (microseconds): [request total 16617 , allow/deny filters 1290 , backend responsiveness 11845 , response processing 1643 , ICAP reqmod <n/a> , ICAP respmod <n/a> ] timestamp: [2012-05-11 10:00:39] [ rid:T6zHJ38AAAEAAAo2BCwAAAMk sid:910e5dd02df49434d0db9b445ebba975 ip:172.18.61.2 ]Which contains the following columns:
Column 1 = "May 11 10:00:39" > Timestamp
Column 2 = "scrooge" > Loghost
Column 3 = "SG_child[808]:" > Application/Process
Column 4 = "[ID 748625 user.info]" > Syslog facility.level
Column 5 = "m:WR-SG-SUMMARY" > Message ID
Column 6 = "c:X vhost:..." > Message [including time statistics and rid, sid, ip]Monitoring log files is critical because it helps you manage any errors in the functioning of your OS. Some the types of relevant information you will receive includes:
Of course, there are log files of high priority that you should always keep track of.
The log files include:
If you were to look into /var/log/messages, you would find:
One problematic scenario is when your /var/log/messages file fills up due to logging misconfiguration. Plus, there will be times when your system’s logging will cause unforeseen issues. This is why it is imperative to understand how to control your logging and where your logs are saved. Plus, there may be some packet loss if there is a large burst of network traffic.
Also, the fact that Syslog is based on UDP means there can be issues with reliability. On the other hand, as systems become more complex, it becomes increasingly important to collect and monitor all relevant data produced by applications.
We analyze this data to determine how systems are behaving.
Plus, logs are considered a reliable data source for understanding current system statistics and making trend predictions. Not to mention, logs are used for activities such as troubleshooting such or rolling back the system after a failure accident.
In terms of securing your log files, you will have many devices to generate that data. Still, it is a best practice to funnel all logs to a dedicated host. We should harden and secure this host.
Moreover, you only want to open up the syslog port in all firewalls between you and the UDP/514. If you have a geographic network, then you should have a local loghost—at each location– that sends data to the central loghost.
You can also rotate a log file once it reaches a particular size. Nonetheless, the UNIX logrotate utility will continue to write the log information to a new file after rotating the old file.
Here are the keys to use:
To rotate a log file for every 1KB, use the logrotate.conf below
$ cat logrotate.conf

/tmp/output.log {

size 1k

create 700 bala bala

rotate 4

}
It gives you three options:
Since an increasing number of organizations are moving to the cloud, the need for log management tools and services has never been greater. It is good to have centralized logs, but you also need the right tools to analyze them effectively. Going through files individually will drive you nuts.
Retrace, one of Stackify’s developer tools, is the only developer tool that combines APM, errors, metrics, and monitoring with logging to provide a fully-integrated, multi-environment tool that gives you app performance superpowers.
For an open-source tool, Logstash can manages and collectes your events and logs. Plus, you can use it along with Kibana.
Syslog is a widely used tool that makes management of complex networks much more straightforward. Plus, with the right tools, you don’t have to worry about the volume of data since you can filter easily and conveniently.
For a list of 46 useful log management tools, check out our list here.
Stackify's APM tools are used by thousands of .NET, Java, PHP, Node.js, Python, & Ruby developers all over the world.
Explore Retrace's product features to learn more.


