Using Node.js as a JavaScript runtime has its advantages. However, it requires significant maintenance to keep it working as expected. Here are the top metrics you should monitor for Node.js performance measurement analysis.
Application programming interfaces or APIs that use the Node.js runtime environment are scalable. Node.js is asynchronous and event-driven, which means the application can handle multiple connections at the same time. These characteristics also means Node.js dispenses with thread-based networking protocols, saving CPU usage and making the application more efficient overall.
However, getting Node.js applications to run just right is tricky. One part of the reason is the Chrome V8 engine it’s built on tends to slow down when encountering CPU-intensive processes. Another part is JavaScript uses dynamic typing, which means Node.js assigns types to variables for each use of the application. This model restricts CPU-thread utilization. Without regular application performance management, dynamic typing can lead to unacceptably slow Node.js performance and memory leaks.
Tools such as Retrace for Node.js automate the monitoring of critical metrics for your application. Retrace provides complete Node.js monitoring in one tool. However, if you want behind-the-scenes knowledge, read on.
This post is about the top five Node.js performance metrics you should regularly monitor, namely:
The function of any API is to relay information from one interface, such as a mobile app, to another. Therefore, ensuring that the API is performing as expected from the user perspective is critical. You want to avoid unnecessary latencies or delays during user interactions. The goal of measuring user-facing latencies is to ensure the API is behaving normally.
Before you can measure the performance of the application, you must establish a baseline. Anything within two standard deviations from the baseline is normal. If any Node.js performance measurement goes beyond that, then your API is behaving abnormally.
After establishing the baseline, you can start assessing transaction performance by identifying the entry point or the interaction that begins the user transaction. With a Node.js API, the entry point is typically an HTTP request, although it could be a WebSocket connection or a service call, depending on the infrastructure.
After identifying the entry point, you can now measure the performance across the app ecosystem to assess if it is performing within normal parameters (baseline + 2 standard deviations). For instance, you find that the response time is more than the two standard deviations from the average response time for that user transaction. The excessive deviation indicates abnormal behavior on the part of the application.
The user-facing metric may shift depending on the time of day and day of the week in which measurement occurs. The data gathered during this measurement will affect subsequent baselines for that time of day and day of the week. The progression accounts for the evolution of the user-facing application and reflects the user experience more than any other metric you can use.
When measuring user-facing latencies, you need to monitor all aspects of the user interface, including:
All applications interact with some form of external or backend services, and these interactions can have a profound effect on the overall performance of your application. The external dependencies may be legacy systems, caching layers, databases, queue servers, or web services.
While developers may have no control over the code of these backend services, developers can manage the configurations of these services. Therefore, it is critical to assess the performance of these backend services to determine if there is a need for reconfiguration. Additionally, you will need to determine if the slowdown of the application is due to problems with the application or the external dependencies.
Typically, an APM tool will be able to distinguish between the application and external services automatically. In some cases, you may be required to tweak the monitoring program to identify external dependency behavior. As with user-facing latencies, you need a baseline to measure the performance of these external dependencies.
With a Node.js application, latency in backend services can alter performance and affect the user experience despite interfacing asynchronously. Exit call types may be:
When you measure your application’s response times when the application communicates with external dependencies, you will be able to identify problem areas and improve performance.
The event loop is a construct of JavaScript that executes a block or tick of synchronous code. The construct executes the code, collects and processes events and executes sub-tasks in the queue. Generally, the event loop processes each message entirely before moving on to another one.
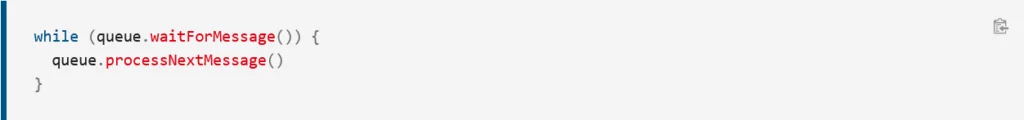
Source: https://developer.mozilla.org/en-US/docs/Web/JavaScript/EventLoop
Node.js is non-blocking and single-threaded so that you can perform I/O operations through callbacks. The application will pick up the next tick in the Event Queue to execute additional code in the background. While Node.js is non-blocking, some events may still have the characteristics of a block, such as:
In other words, Node.js allows for the simultaneous execution of code blocks, essentially merging code from two or more transactions to wait in the Event Queue. The issue with merging code is that when code from one transaction (X) blocks the event loop, it slows down the performance of another transaction (Y).
This model for executing code can make for faster transactions, but it can have a domino effect on the performance of all requests in the Event Queue. Therefore, monitoring the event loop is crucial in any Node.js application to identify transaction behavior that might affect overall application performance.
Potential memory leaks that will affect Node.js performance depend on the structure of memory usage. Values in JavaScript applications go into heaps and stacks.
Memory leaks are common with Node.js as it stores values in the heap when referencing objects for an extended period, even when those values are not needed. Node.js can do this because the maximum heap size of a single process is 1.5 GB. To release the space, Node.js uses garbage collection.
The steady increase in the process memory size without activating the garbage collection function indicates a memory leak, which you’ll want to prevent because it can be tough to find the root causes. Monitoring the released memory between garbage collections, heap size and heap usage will give you an early warning of a potential problem with memory leaks.
Another source of memory leaks is incomplete cleanups. Node.js applications automatically trigger the garbage collection cycle to identify “dead” regions of memory – memory used by inactive objects in the heap – for cleanup.
Ideally, each cleanup will leave the heap free of inactive objects. However, that does not always happen. Some objects stay in the heap, take up memory and may even grow. These inactive objects increase memory usage, which essentially classifies them as memory leaks.
Monitoring the heap usage before and after garbage collection will indicate if you are harboring potential leaks in the form of inactive objects. If the heap usage continues to grow even after several cycles of garbage collection, then that indicates a possible leak.
If that happens, you can collect heap data to identify the classes and objects that tend to stay in the heap so you can formulate a management plan. You can then perform a heap dump to clear it. Heap dumping taxes the application significantly, so it might be best to execute that when the application is not in use.
Finding memory leaks can be pretty tricky, and having the right tools will help you make a proper diagnosis.
The last Node.js performance measurement metric you will want to monitor is the layout of your application’s critical functions and connections or application topology. The cloud has changed the structure of application topology in general, making it more flexible to accommodate user demand. Monitoring your topology will indicate if the size of your environment is optimal for your needs.
When assessing your application topology, you need to measure your user-facing load and container performance. To determine if you have enough servers to satisfy your user-facing demand, you need to refer to the baseline plus two standard deviations when the load increases during peak times. When the application slows down consistently, it indicates the need to increase the number of servers.
The same applies when assessing container performance. If any of your server tiers come under appreciable strain during operations, then you need more servers for that tier. Actions based on an assessment of one server will not be appropriate, as the load may be due to factors other than use, such as garbage collection. However, when the tier as a whole is under duress, then you can safely assume it cannot handle the load it receives.
Regular monitoring of application performance is proactive. You can avoid considerable trouble down the road by identifying potential issues before they become a problem. Node.js applications can benefit significantly from monitoring these performance metrics.
The most popular tool for monitoring Node.js applications is Retrace, a robust APM system that helps you track performance and availability, find bottlenecks and fix errors quickly and efficiently.
As an all-in-one APM tool, Retrace monitors not only your Node.js applications and servers, but also provides integrated code profiling, error tracking, centralized logging, full transaction tracing, deployment tracking and real user monitoring.
Try your FREE 14 day Retrace trial to get the results you need now!
Stackify's APM tools are used by thousands of .NET, Java, PHP, Node.js, Python, & Ruby developers all over the world.
Explore Retrace's product features to learn more.


