
Computer programmers are bombarded with jargon and terminology. Experienced programmers have learned how to work with these terms. Beginning programmers become frustrated and confused. To some degree, it’s a rite of passage in the programming world. It separates the wheat from the chaff.
Troubleshooting and debugging are two concepts programmers need to learn and distinguish between. You not only need to understand the two terms, but understand how they differ and know the common traits they share. Programmers will spend more time with debugging than with troubleshooting. However, their enhanced operational duties will cause them to troubleshoot more frequently.
Troubleshooting is a process that helps people identify issues or problems occurring in a system. Troubleshooting tends to exist at a higher level than debugging and applies to many components of a system. It’s a process of parsing out the items that are causing problems. This process requires interviewing the end users of the system to find out the steps they took to cause the problems.
Troubleshooting can be applied to any system. For instance, doing your laundry can be considered a system that consists of a washer and dryer. If one of those components (i.e. the washer or dryer) fails, you need to troubleshoot where the failure is occurring. It may be beyond your expertise to fix it, but you start by trying to identify what may be causing the problem. It could be as simple as turning on the water or plugging the dryer into the wall.
Debugging is a subset of troubleshooting. It requires finding problems as they relate to computer code. As a programmer, when you are tasked with debugging a module of code, you find what is causing the problem and then fix it. This is an oversimplification. There may be several points of failure, and sometimes it’s not obvious where the problems are occurring. For example, you may be led to believe that the JavaScript code in a browser is failing, when in fact it’s a web server issue. The process is abstracted when many of your servers exist in a third-party cloud environment, which brings new sets of challenges.
As already mentioned, debugging is considered a subset of troubleshooting. However, troubleshooting does not always entail solving the problem at that moment in time. There may be procedural constraints or workflow protocols that prevent the issue from being solved immediately. Debugging, on the other hand, is meant to discover and fix a problem all in the same session, whenever possible.
People use the two terms interchangeably, which can add to the confusion. Even Microsoft blends the terms.
Programmer roles are being redefined, largely due to changes in the industry. For instance, with DevOps, it’s possible to run developer-only departments, eliminating the operations department. This is more than just theory as Stackify does not use an Ops team. The developers become more involved with the operations activities of the company. This means they will take on more troubleshooting tasks than they did in the past.
As a software developer, knowing how to troubleshoot at a high level is helpful, but, you will spend more time debugging. Therefore, it’s beneficial to learn a few debugging techniques. It’s difficult to map out an exact plan for debugging as different environments will offer different sets of challenges. However, here are some common debugging methods that can help in many situations.
Software usually fails when something in its ecosystem has changed. This change could be a new user following the wrong procedures, although software should be robust enough to prevent this from happening. Checking for changes occurs in both categories of troubleshooting and debugging, and should be the first task in the discovery process. Log files and version control can help you with this process.
Programmers jump into the code prematurely, often in response to an irate client or a stressed-out manager. If they put on their operations cap while exploring the problem, they may discover it has nothing to do with the code. They would look at configuration files to see what changes occurred if any. They will take a higher-level approach that can help them isolate the problem quicker than if they simply jumped into the code. While starting with debugging may still get to the problem, it’s possible the code isn’t what caused the situation.
Tools can help you identify where problems are happening. They exist for debugging and troubleshooting. They have specific purposes that can deceive you in your analysis. These tools are often platform-specific or programming language-specific. They cannot determine problems that are happening with outside systems.
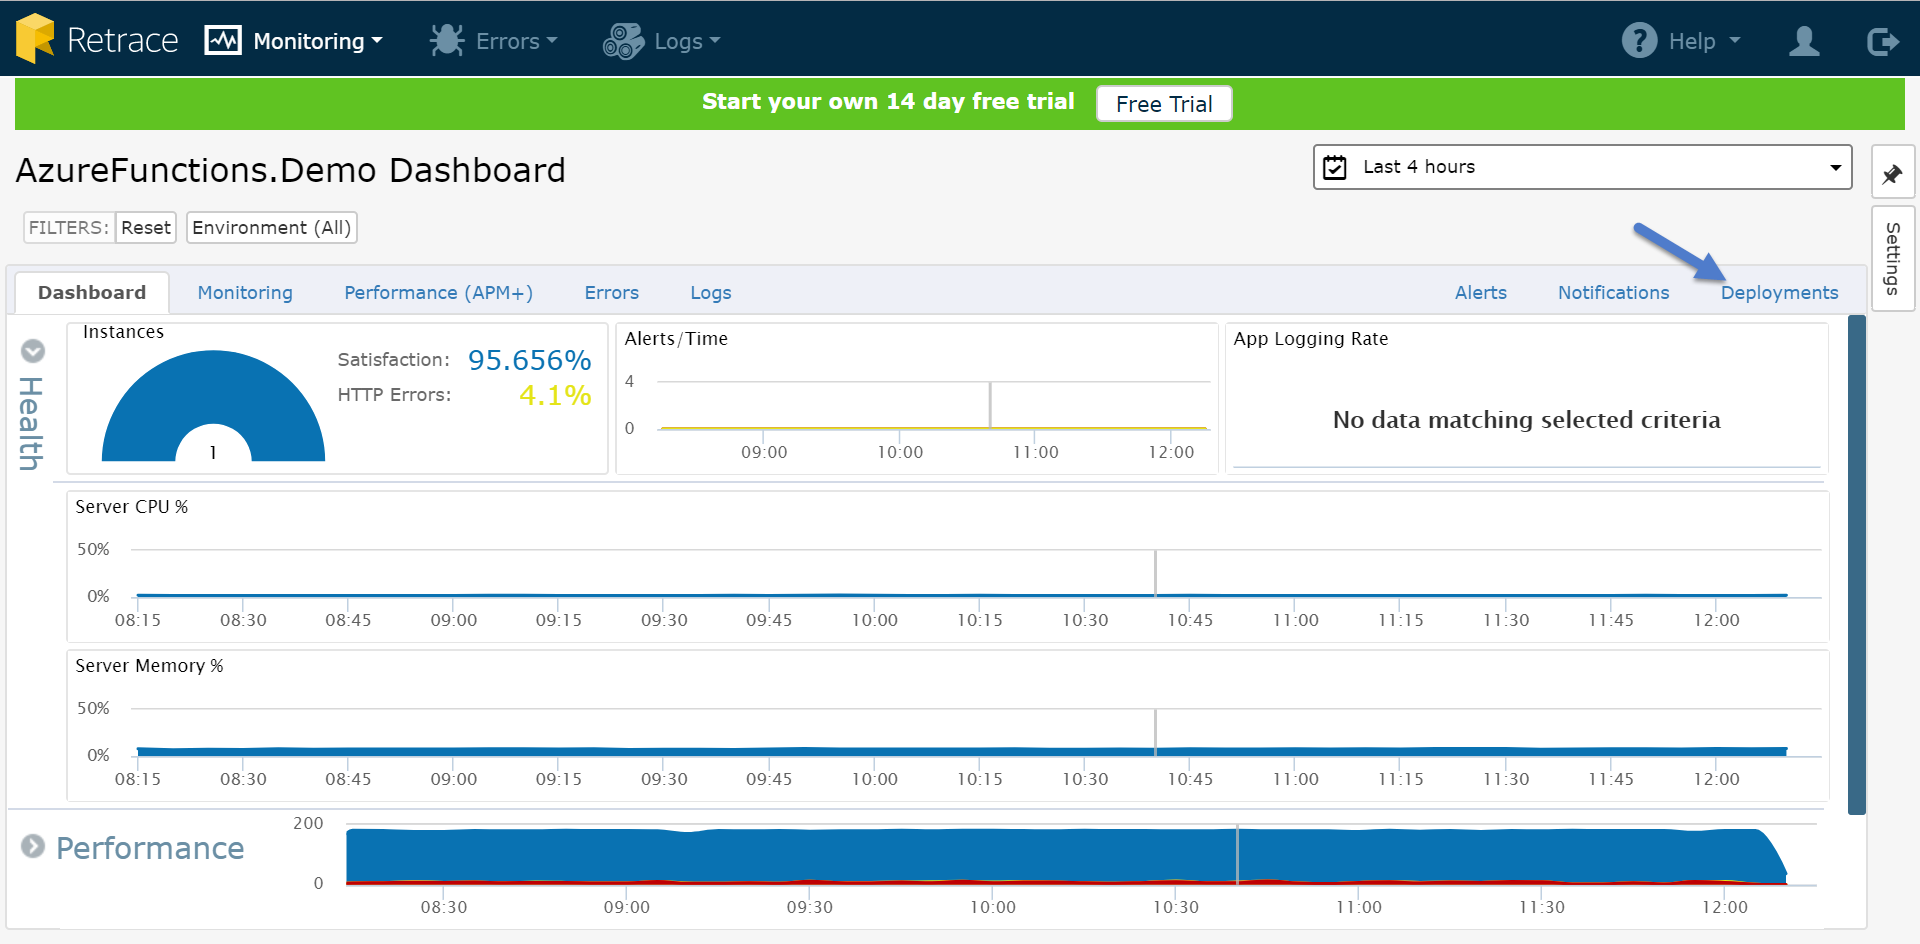
One tool that has made significant headway in this area is Stackify Retrace. A key feature of the software is in Deployment Tracking. This helps monitor changes between deployments. It is capable of reporting deployments on multiple servers and you can drill down to get to the heart of the problem.
When you start developing code, you will find that your code will be the culprit more often than you care to believe. Software development is no stranger to Murphy’s Law (Anything that can go wrong, will go wrong). When a manager or team lead identify bugs, make sure it’s not your code that is causing the situation. Then, check it again to be certain. If your code causes problems, you can’t save face if you declared it bug-free. For obvious reasons, you should avoid this situation.
It’s understandable why developers want to pass the buck. They have already moved on to the next set of coding assignments. Developers like to develop code, not debug it. While understandable, it’s never excusable. Take the time to remove any doubt that your code is causing problems.
When you are confident your code is not causing the bugs, offer to help others find the problem. That shows you as being a good team player. Helping others also exposes their processes of debugging code. Most development teams consist of several experienced coders. These coders have been in the trenches and have worked on plenty of projects with enough debugging sessions to lose count. They know a thing or two about how to debug their code.
It’s unlikely for you to stay at one company for long periods. Therefore, you will be exposed to several different development and debugger tools based on budgets and team preferences. You will be placed in situations where you are asked to debug with tools you haven’t used before. If you are under the gun with a debugging request and you aren’t familiar with the tool, use print statements. This is a tried-and-true method since the beginning of coding. It’s not robust, but it works. Print statements are common in most programming languages. They allow developers to display values to the intended output stream. This makes them perfect for using as part of a basic debug method.
Do you remember what you had for lunch three months ago? Probably not. Therefore, what makes you believe you will remember how you solved a problem three months ago? Bug tracking is a great way to capture problems that team members have experienced and fixed. You may already have a bug tracking solution. If so, it is time to use it. If not, become an advocate. However, find a solution that is easy to use and will encourage participation from the team.
Tools to help with troubleshooting and debugging are getting more sophisticated. Stackify Retrace can help development teams troubleshoot. You can think of the software as Mission Control where you can monitor all the pieces of a system and detect the failure points quickly. Retrace associates specific error log entries to the problems it identifies that makes the software a huge timesaver.
Stackify has created a great software package for debugging called Prefix. Prefix helps developers find and fix bugs as they are developing their code. They can see the impact of their changes immediately on all the components their code interacts with.
Retrace and Prefix are built on the foundation of Continuous Integration and Continuous Delivery (CI/CD). CI/CD uses the concept of integrating (and possibly deploying) several times per day, with small feature sets included to minimize the impact of integration failures. It’s easy to revert in the event of failure. Debugging small feature sets is enhanced by Prefix, which allows developers to feel confident with their integrated versions. Debugging is on-the-spot with Prefix, so developers can react and adjust their code.
Retrace can let development teams determine all of the points of failure, which allows them to deploy code instantly and measure the impact of the deployment. That is bliss when troubleshooting.
Stackify's APM tools are used by thousands of .NET, Java, PHP, Node.js, Python, & Ruby developers all over the world.
Explore Retrace's product features to learn more.


