Track Every Metric About Your Applications

Easy to Use

Easily configure metrics to track across every instance of your application

Smart Defaults

Not sure what to monitor? No problem! Retrace has smart defaults

Scales With You

Retrace can monitor apps that scale up and down with ease

Out of the Box Smart Application Metrics Monitoring

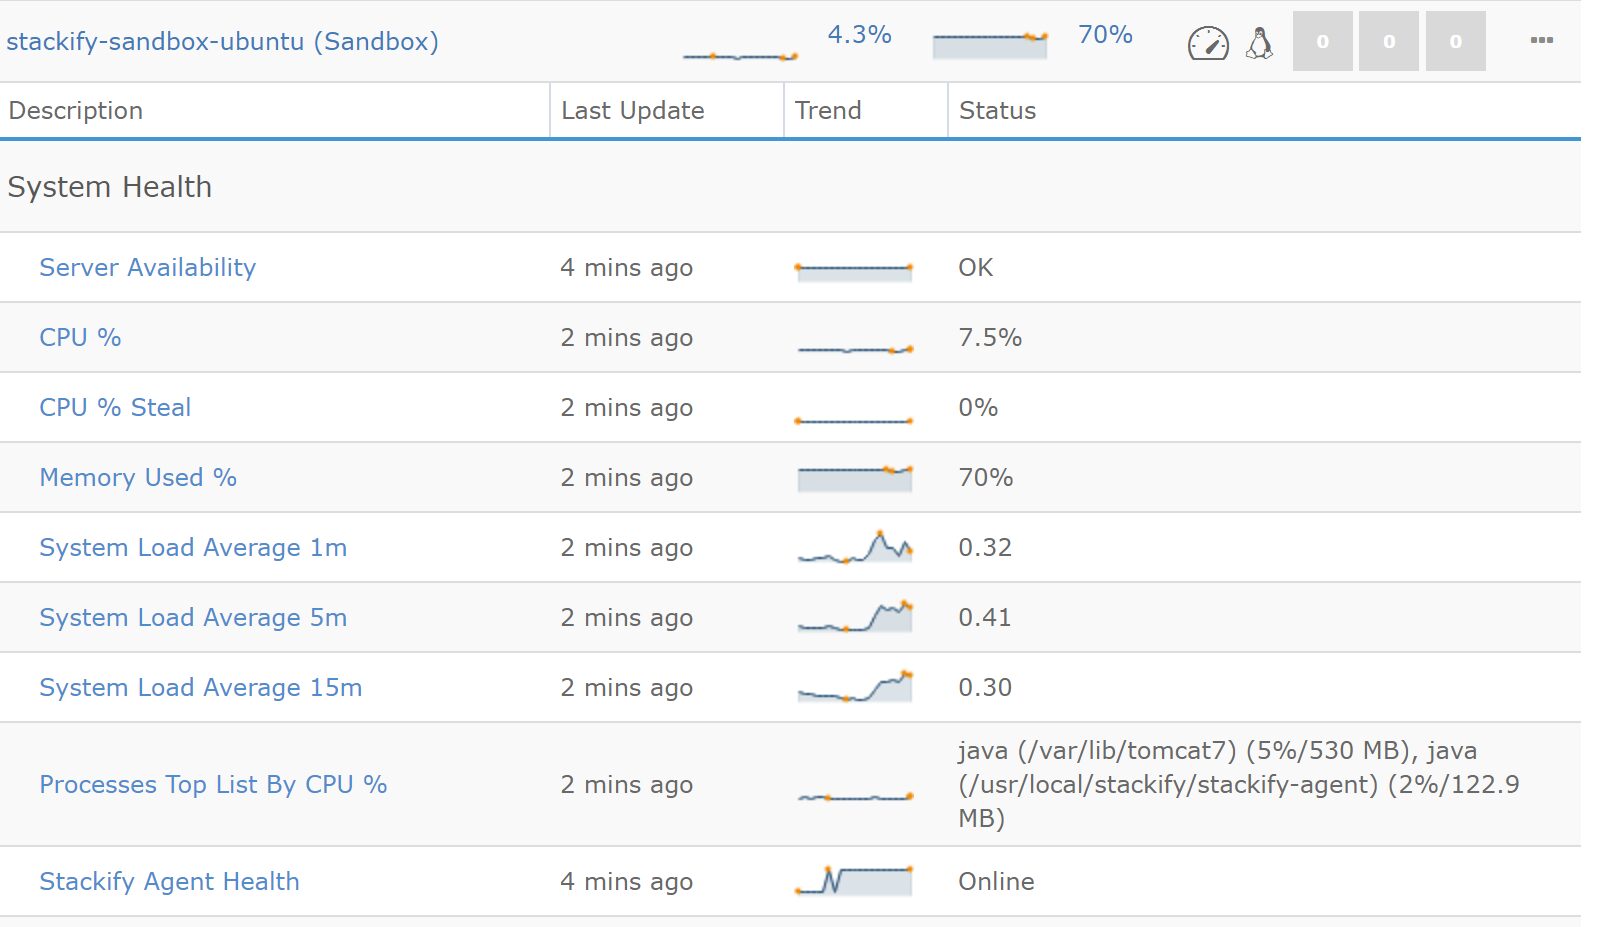
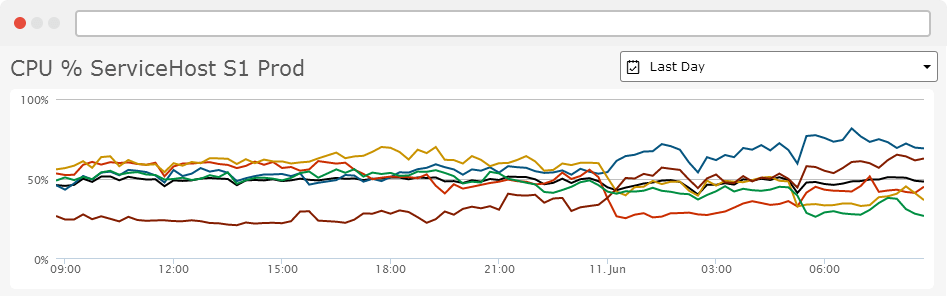
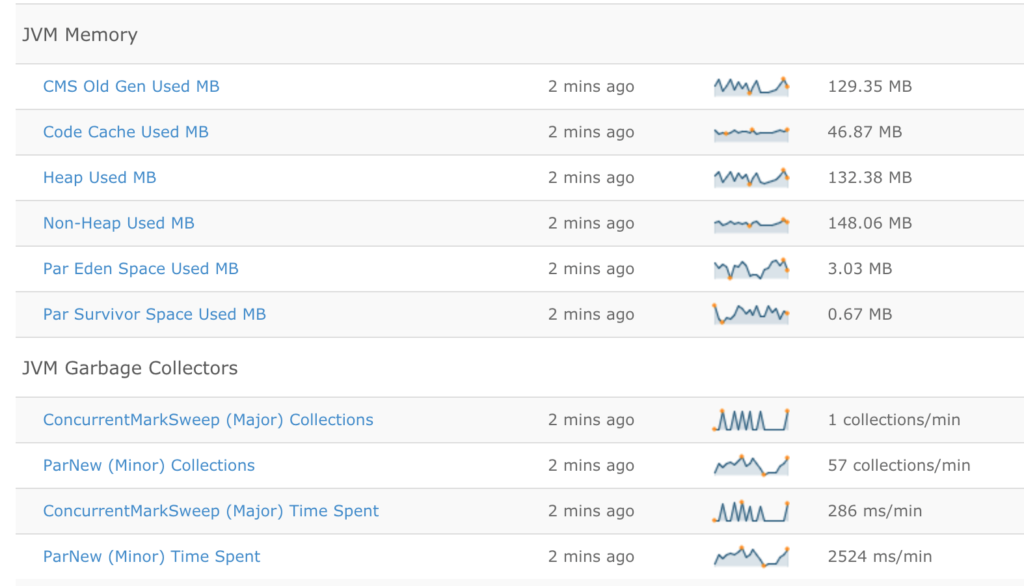
Retrace will automatically track important JMX and Windows Performance counters.

Not sure what to monitor? No problem.

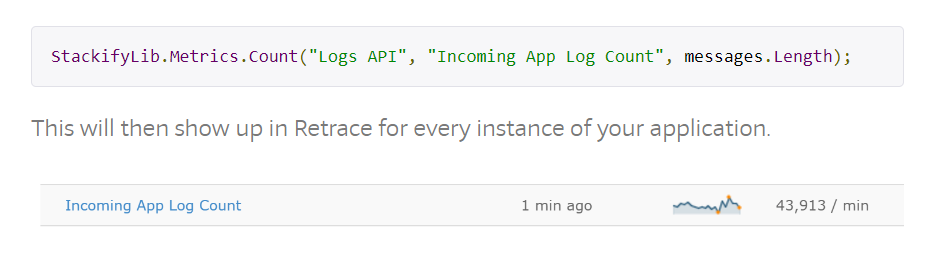
Retrace will automatically track and monitor key metrics for your Java, PHP and .NET applications.

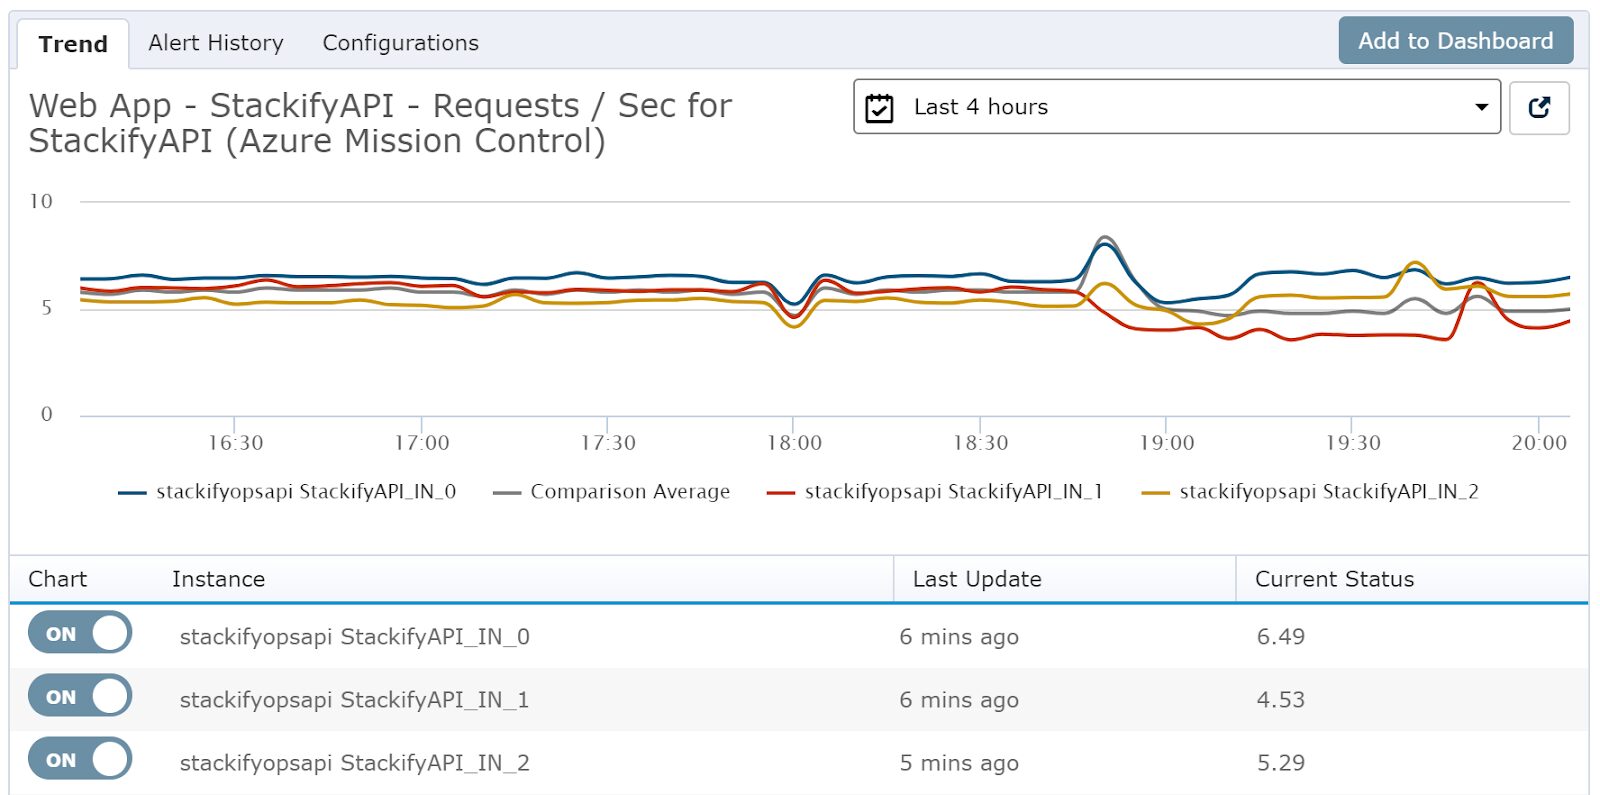
  • Web application traffic
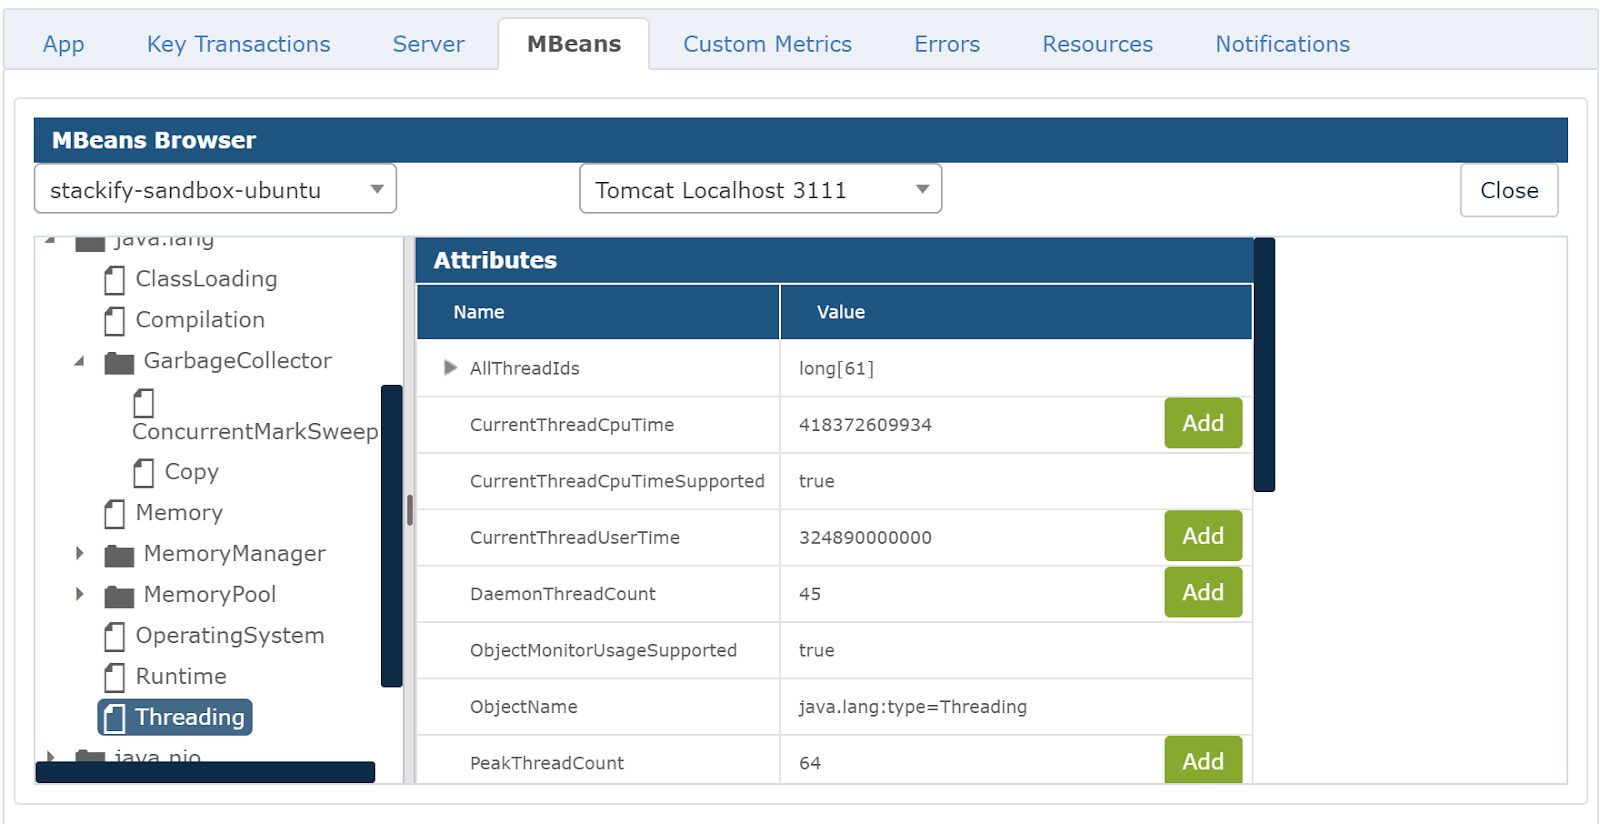
  • Tomcat & JBoss JMX MBeans
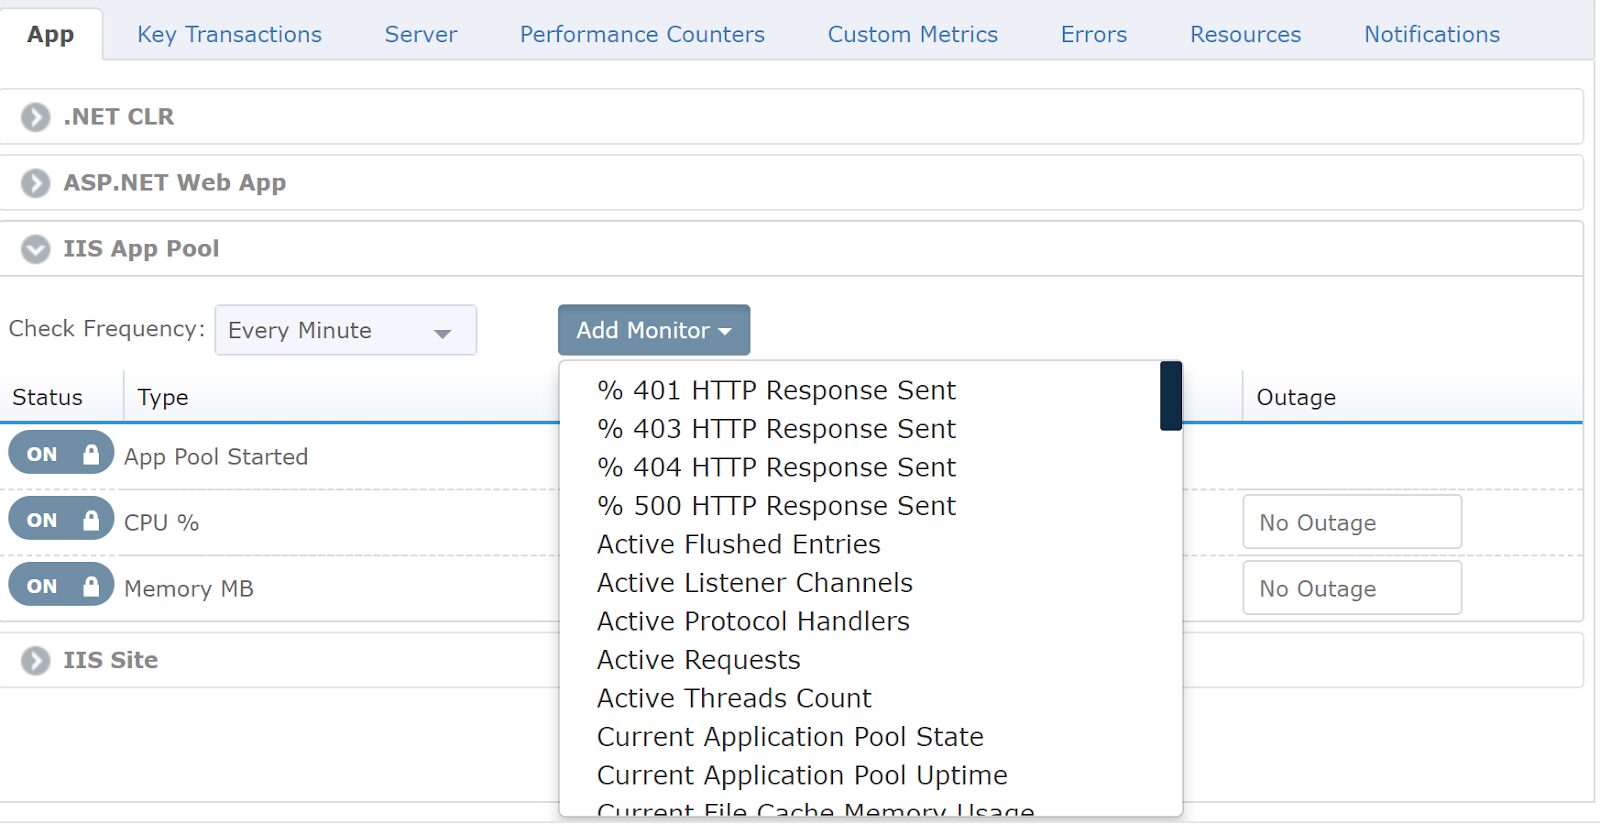
  • .NET & IIS Performance Counters
  • Unique MVC action or page
  • Error rates

Easy to Configure for .NET & Java Metrics

Monitoring the metrics of your application frameworks doesn’t have to be hard. Retrace makes it easy!

Monitor Performance Counters the Easy Way

Monitoring Windows Performance Counters can be difficult. There are numerous categories and the instance names can change every time the application restarts.

Retraces makes it easy. Just select the name of the metrics from a dropdown and Retrace will automatically monitor it for every instance of your application across every server.

Remote JMX MBeans Browser

After configuring Retrace with your JMX connection, you can remotely browse all of your MBeans online. Browsing your MBeans has never been easier.

Retrace makes it easy to identify MBeans to monitor and configure monitoring of them for every instance of your application.

Compare Across Application Instances

Retrace makes it easy to chart, compare, and trend metrics across all the instances of your applications. Quickly compare applications metrics across your servers to look for outliers.

Create Your Own Custom Application Metrics

Don’t Worry, Retrace Will Monitor Your Servers, Too.

Retrace Includes Robust Monitoring Capabilities

Retrace is like a swiss army knife for monitoring your applications

Don't Get Left in the Dark

Get Started with Retrace Today.