10 Best RUM Tools for Improving Your User Experience

By: Zach Norton
  |  March 14, 2024
10 Best RUM Tools for Improving Your User Experience

Having user-friendly programs is paramount for any software company’s success. To gain a better understanding of your users’ experience and enjoyment, it’s vital that you learn how customers interact with your app or website. Real user monitoring (RUM) solutions enable your company to visualize how users interact with your software, helping you learn what works best for your customers so you can thrive against the competition.

Let’s go over 10 of the best RUM tools for improving user experience.

1. Retrace

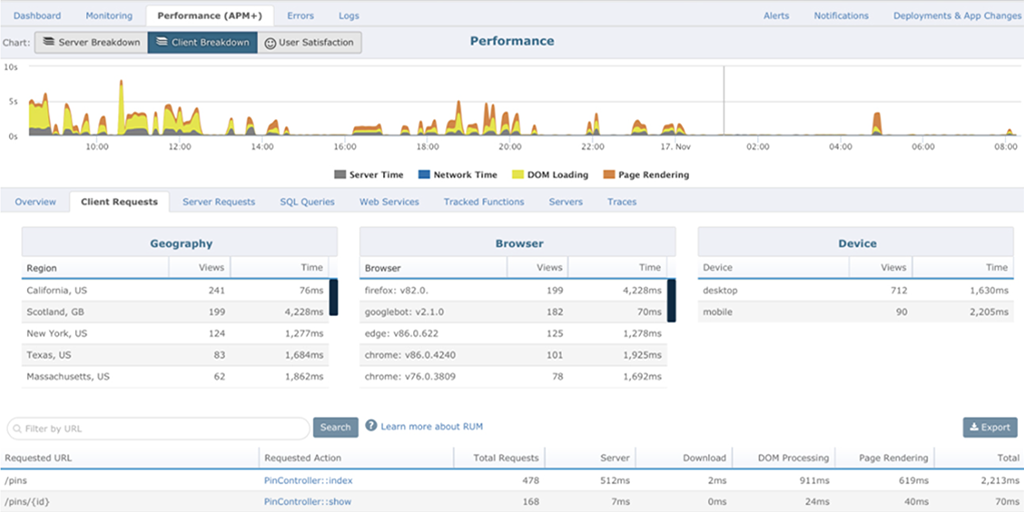
There are many benefits of utilizing real user monitoring, and Retrace helps you get a complete picture of application performance. The tool provides extensive monitoring, helping optimize software performance from the code level to the network edge.

As a full-cycle AMP solution, Retrace boosts your understanding of real users’ overall experience, correlating client-side traces with errors, logs and server-side metrics. Retrace delivers an intuitive experience with extensive insights into each user interaction, creating a better environment for user satisfaction. The tool helps speed up problem-solving capabilities and resolves bottlenecks for each application demand.

Features

  • Operates with Microsoft Azure and AWS
  • Supports .NET and Java for APM
  • Supports .NET, Java, Node, PHP, and Ruby for errors, logs, and monitoring
  • Supports .NET Core
  • Enhanced async pattern profiling for Windows Services and other non-web applications
  • Data collection
  • Sessionization of user visits
  • Transaction tracing
  • Custom metrics monitoring
  • Visit reporting
  • Reporting and segmentation
  • Comprehensive alerting

Price

Retrace offers a free 14-day trial, after which pricing starts at $99 per month. Check out how you can get started with Retrace RUM today!

Pros

  • Provides unified, full-stack monitoring
  • 7-day trace retention
  • Easily go from viewing RUM metrics to detailed logs and traces
  • View the timing of each transaction
  • Optimize problem-solving, helping customers have smooth interactions
  • Graphs and charts to visualize customer experience and drill-down capabilities

2.  Akamai mPulse

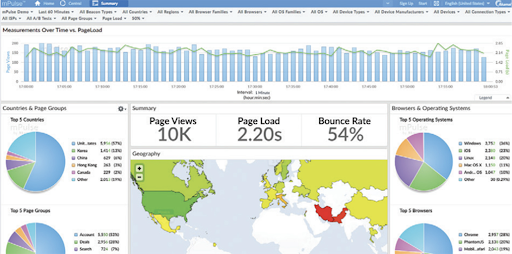
Akamai mPulse helps you understand the impact of performance and error issues on user experience with conversions or page views, allowing you to see performance errors and use data insights directly from the user’s browser.

Features

  • Real-time user insights
  • Analyzes metrics sitewide
  • Distinguishes human traffic from bots
  • Real-time alerts
  • Third-party visibility

Price

The mPulse tool has a 30-day free trial and monthly pricing available upon request.

Pros

  • Single-page application support
  • Stores user insights for 13 months
  • Metrics include Google Core and Core Web Vitals

Cons

  • Not as user-friendly and intuitive as other tools
  • Can be slow
  • No support error tracking

3. AppDynamics Browser RUM

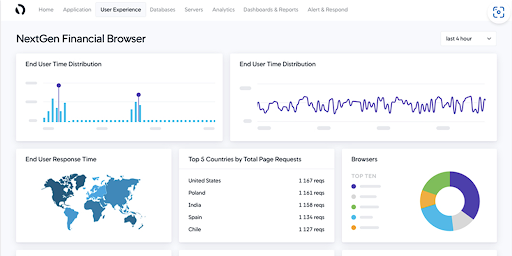
AppDynamics tracks visitor journeys and provides insights into their interactions with your website or application. Self-learning algorithms use the app’s behavior to form web metrics with automatic error detection and resolution.

Features

  • Segmented session data related to location, device, and more
  • Experience Journey Map lets you see how users interact with browser-based applications
  • Helps reduce MTTR with real-time data from user interactions

Price

AppDynamics offers a free 15-day trial and starts at $0.06 per month per 1,000 tokens.

Pros

  • Self-learning platform
  • Free training

Cons

  • Can be pricey

4. Datadog Real User Monitoring

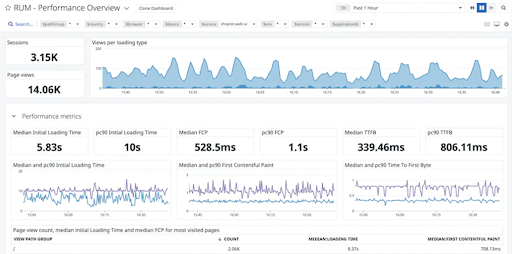
Datadog Real User Monitoring gives you comprehensive visibility into individual user activity in real time. This tool allows you to monitor all aspects of user journeys on your application or website, tracking performance during the durations, pages visited, resources loaded, and more.

Features

  • Triage issues with end-to-end view of user experience
  • Capture critical user actions like checkout button click and more
  • Collect and correlate user action during a user’s session
  • Visualize user experience with time series, top lists, and tables

Price

Datadog offers a free option with Core Collection and Visualization features. The Pro version is $15 per month per host, and the Enterprise version is $23 per month per host.

Pros

  • Simple interface
  • Dependency mapping
  • Dashboard screen with helpful graphs

Cons

  • Navigations can be counterintuitive
  • Lack of thorough documentation in some areas
  • Finding the right metrics or dashboard is less intuitive than other platforms

5. Dynatrace RUM

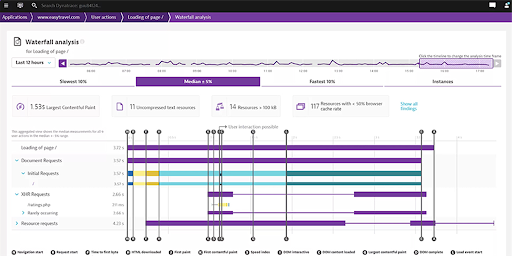
Dynatrace RUM provides complete instantaneous insight into the customer experience. You can track the activity of users on all mobile and web applications across all devices and browsers to improve customer experience.

Collect business-relevant metrics, allowing you to correlate performance issues with potential impacts on your business.

Features 

  • Waterfall analysis gives insight into bytes downloaded, interactive time, network time, and UX time
  • View JavaScript error messages and know the user actions that triggered them, and view the stack traces
  • Capture full visibility of customer experience across every digital transaction
  • Replay individual customer sessions
  • Real-time, AI-based analysis

Pricing

Dynatrace offers a 15-day free trial, after which:

  • Full-stack monitoring starts at $74 per month
  • Infrastructure monitoring starts at $22 per month
  • Digital experience monitoring starts at $11 per month
  • Application security starts at $15, open ingestion starts at $25
  • Cloud automation starts at $0.10 per cloud automation unit

Pros

  • Intuitive, user-friendly dashboard
  • Interactive interfaces and visual reports for ROI tracking
  • Mobile monitoring breakdowns

Cons

  • Can be pricey
  • The user interface can be hard to grasp at first

6. New Relic Browser

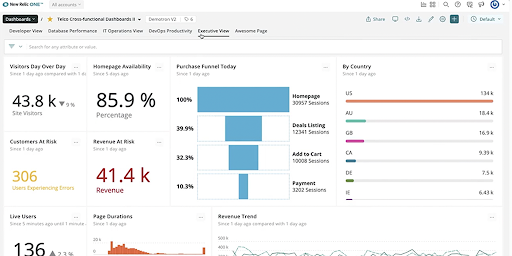
Correct frontend issues before they affect your business with New Relic’s advanced RUM tool. This tool lets you view features from the user’s perspective, allowing you to monitor sessions from the moment a user enters the app or website until they exit.

Features

  • Geographies can be filtered to measure user engagement by location and device
  • Compare source maps and stack traces to troubleshoot backend issues affecting end user
  • Individual session performance reports
  • Browser page views and page load times
  • View route changes in applications with SPA architecture

Price

New Relic offers a standard option with fewer features for free. Pro plan and Enterprise plan pricing are available upon request.

Pros

  • New Relic Edge with Infinite Tracing lets you observe 100% of your distributed traces

Cons

  • Many features are available for Pro accounts only
  • Lack of detailed HTTP metrics
  • Reports are not as comprehensive as other tools

7. Pingdom

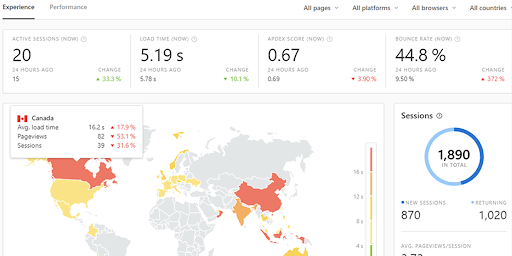
Pingdom combines uptime, transaction, and real user monitoring. This tool helps you analyze data for specific users and gain better insight into regional performance, monitoring millions of pageviews without jeopardizing data.

Features

  • Visualize geographic hot spots with live mapping
  • Gain insights into user behaviors
  • Advanced filtering gives granular visibility
  • Easy to share user insight reports
  • Set performance levels of user experience and measure metrics like Apdex score
  • Analyze load time or first byte

Price

Pingdom offers a 30-day free trial. Their RUM tool starts at $10 per month.

Pros

  • Synthetic and end-user monitoring
  • Notifications to multiple destinations with text messages and email

Cons

  • Custom options can be expensive
  • Not the most user-friendly
  • Has a difficult interface that requires a sharp learning curve

8.Raygun Real User Monitoring

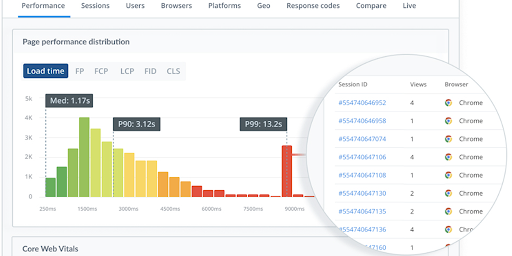
Raygun’s RUM tool allows you to view visitor interactions and solve performance bottlenecks with easy detection and diagnosis. Assess real-time data from user sessions and suggest improvements for a flawless experience.

Features

  • Surface real-user insights
  • Language support for JavaScript, Angular, Xamarin, React, iOS, and Android
  • Get waterfall breakdowns of load times
  • See individual user sessions
  • Filter and compare data for greater control and granularity

Price

Raygun offers a 14-day free trial and starts at $80 per month.

Pros

  • Straightforward and easy interface
  • Can be integrated with Slack
  • Easy to set up

Cons

  • No log management solution to bring RUM and log management together under one roof

9. Sematext Experience

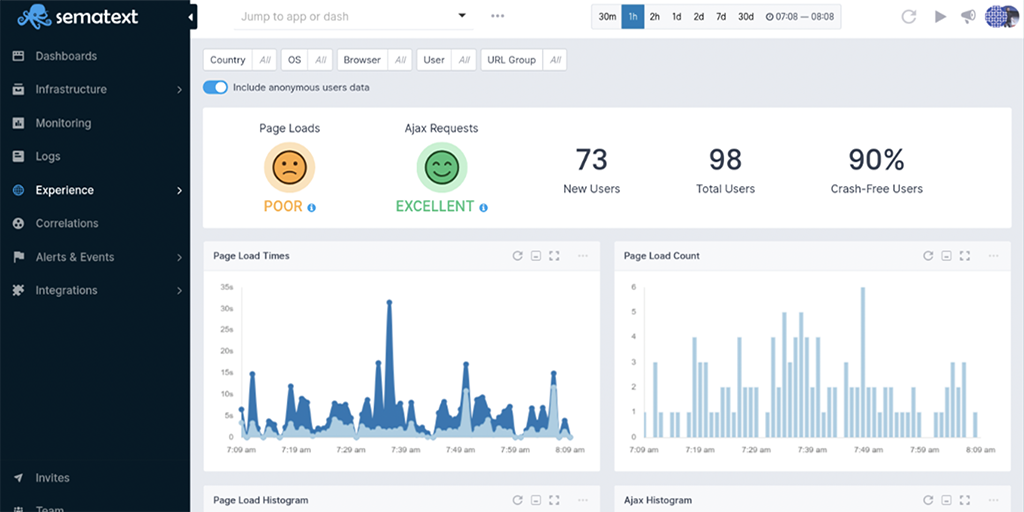
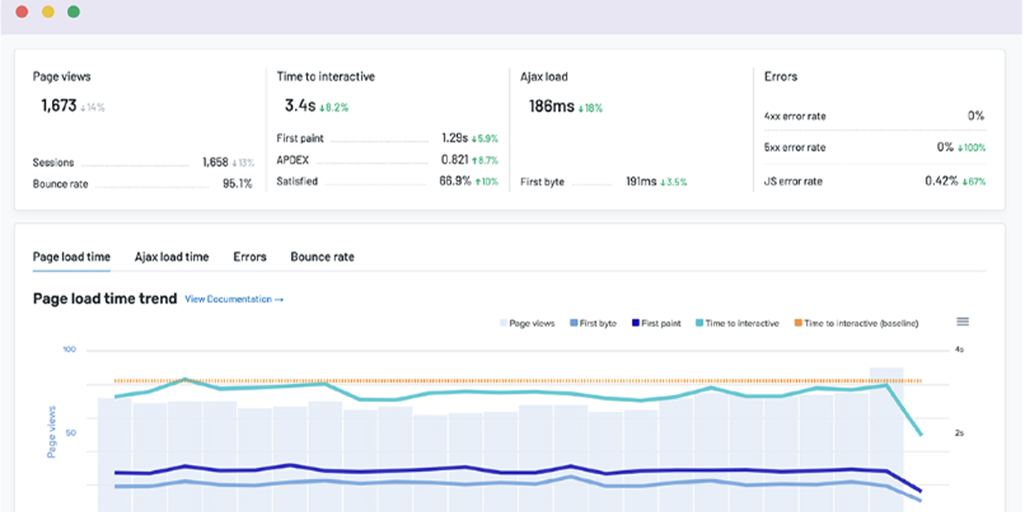
Sematext Experience offers accurate insights into aspects of websites and apps that influence user experience.

This RUM tool was created so DevOps and BizOps can collaborate to receive in-depth data to ensure customer satisfaction. Individual session insights at the page level allow users to better understand the customer experience.

With Sematext Experience, you can set up alerts for script errors, page load time, and Apdex score, and receive notifications anytime an error is detected.

Features

  • See composite frontend performance metrics or dissect by country, device, and more
  • Web application monitoring for all fired HTTP requests
  • Track individual user session performance
  • Set up alerts for Apdex score and page load times
  • Review page load events as they are recorded and displayed on charts

Price

Try a 14-day free trial before starting at $9 per month, or you can get the standard option for $19 per month or Pro version for $89 per month.

Pros

  • Easy installation
  • Sematext Cloud offers metrics, logs, and user end monitoring all in one location
  • Supports popular frontend frameworks like React, Ember, and Angular
  • URL grouping for HTTP requests and page-load events

Cons

  • Data can occasionally be delayed

10. Uptime.com

While synthetic monitoring can be used to launch automated custom tests for your website or web services, this real user monitoring gives you statistics on events that occur daily during live operations.

Uptime’s RUM tool uses industry Apdex standards to report response times and improve frontend performance while filtering user agents and bots from interfering with user metrics. Diagnose website speed issues and evaluate and discover the cause of errors before they become a problem.

Features

  • Track page load time trends
  • Filter user agents and bots that inflate user metrics
  • Correlate changes in bounce rates with peak load times
  • Monitor real users

Pricing

Uptime.com offers a Starter Plan for $20 per month, an Essential version for $67 per month, a Premium version for $379 per month and a Custom for $699 per month.

Pros

  • Easy-to-use dashboard
  • Console can be accessed through any standard web browser
  • Shows live reports via graphs
  • Can be integrated easily with other monitoring tools

Cons

  • Relatively expensive
  • Graphs could be more detailed

Why Do You Need a RUM Tool?

Running a business on the internet is filled with risk. Having an arsenal of tools at your disposal will help your business thrive and give you an edge over the competition. In addition to critical cybersecurity tools like vulnerability and penetration testing tools, real user monitoring can help you understand how a user is enjoying your software and give you peace of mind when it comes to combating errors and keeping track of important metrics.

Improve Your Code with Retrace APM

Stackify's APM tools are used by thousands of .NET, Java, PHP, Node.js, Python, & Ruby developers all over the world.
Explore Retrace's product features to learn more.

Learn More

Want to contribute to the Stackify blog?

If you would like to be a guest contributor to the Stackify blog please reach out to [email protected]