
Real User Monitoring is a type of performance monitoring that captures and analyzes each transaction by users of a website or application. It’s also known as real user measurement, real user metrics, end-user experience monitoring, or simply RUM. It’s used to gauge user experience, including key metrics like load time and transaction paths, and it’s an important component of application performance management (APM).
Let’s take a closer look at RUM, how it differs from other types of monitoring and some best practices for success.
Real User Monitoring is a form of passive web monitoring. We say “passive” because it relies on services that constantly observe the system in the background, tracking availability, functionality, and responsiveness.
By contrast, Synthetic Monitoring is active web monitoring. In synthetic monitoring, behavioral scripts are deployed in a browser to simulate the path an end-user takes through a website.
In addition, this active monitoring permits webmasters to test the application before launch. That makes it an essential tool for sites with a high volume of traffic. Unlike synthetic monitoring, RUM never rests. It collects data from each user using every browser across each request.
RUM technology collects a website or app’s performance measures straight from the browser of the end user. A small amount of JavaScript is embedded in each page. This script then collects data from each user as he or she explores the page, and transfers that data back for analysis.
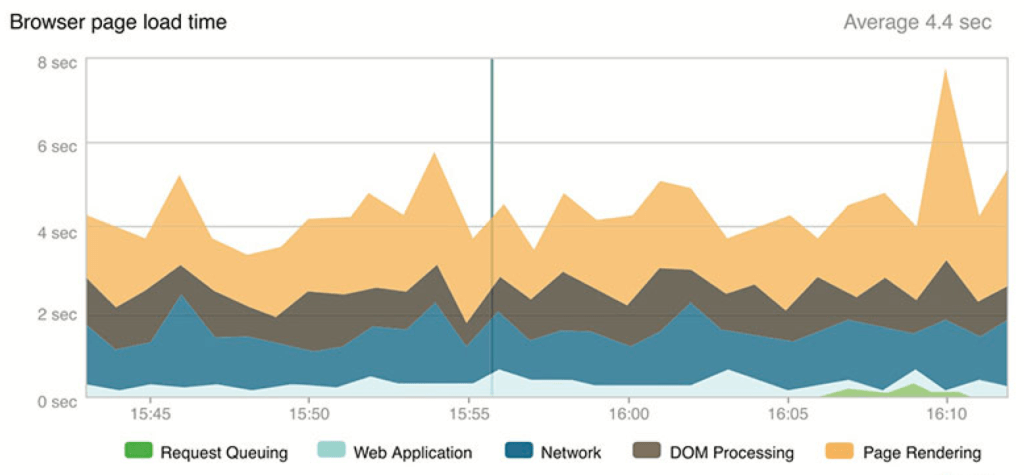
Data visualizations are particularly useful. Because RUM collects data points from such a high volume of users over a wide array of metrics, visualizations such as bar, chart, and area graphs make these large volumes of data more easily digestible – meaning it’s easier to glean actionable insights from your data.
In the real world, it’s used to monitor applications and websites in order to surface problems other testing methods can’t unveil. Some examples include:
RUM examines the ease of user interaction on the cloud, mobile, or web-based applications. It then produces a performance report that can be used to troubleshoot and fix identified infrastructure or user issues.
It allows the capturing of live sessions and monitoring of user experience across several tiers. With it, we can monitor which pages the customer visited, examine response times, and see when and where certain pages malfunctioned.
RUM can help identify how page visitors are using a site or app. It also provides page metrics such as load time for analysis of a page, objects and even individual visits.
For all its benefits, RUM does have several limitations. Combining the process with synthetic monitoring fills the gaps nicely.
There are several best practices that can help you get the most out of RUM including:
There are a variety of tools available that support RUM. We compare 18 different APM tools in this post, some of which offer real user monitoring capabilities.
Stackify’s application performance management solution, Retrace, provides real user monitoring, as well as in-depth metrics to make it easy for you to determine why your app is having performance issues, down to which web requests are happening most often and which requests take the most amount of time. And with its advanced reporting features, you can review the performance of every individual request – not just the top five – along with robust log management capabilities, customizable method level profiling, comprehensive error monitoring, integrated log searching, and much more.
Today’s post was all about Real User Monitoring, or RUM.
We’ve defined this technique, explained how it works and mentioned some typical examples. Also, we’ve covered the basic steps of RUM, its main benefits and limitations. Finally, we’ve listed some best practices that can help you and your organization reap all the benefits that RUM can provide, and wrapped-up by mentioning RUM tools you can checkout, providing lists to do so.
So, do we have a verdict about RUM? Should your organization adopt it?
Let’s start by saying that each organization is unique when it comes to its attributes, history, and needs. So, despite Real-User Monitoring being an incredibly valuable resource, it might not be the best fit for your organization. There might be scenarios where most simpler alternatives are enough.
Remember that before committing to a significant investment, of any type, it’s crucial to weigh the benefits of said investment against its costs and decide whether it fits into the overall business objectives of the organization.
That being said, it’s clear to us that Real-User Monitoring is the “winner” in the long run. Don’t get me wrong: as we’ve mentioned, Synthetic Monitoring is essential for high-traffic websites, while also being immensely valuable for testing the application before it hits production.
We live in an era that’s increasingly mobile, and always online. Technology changes in the blink of an eye. In such a scenario, companies have to move fast and respond to events as quick as possible if they want to survive and thrive. But you can’t answer to an event you’re not aware of, and that’s exactly where techniques such as RUM come in useful.
The capacity to monitor users in real-time is—and will continue to be—an essential tool in the toolbelt of any organization.
Stackify's APM tools are used by thousands of .NET, Java, PHP, Node.js, Python, & Ruby developers all over the world.
Explore Retrace's product features to learn more.


