
Exploratory data analysis is a key component of the machine learning pipeline that helps in understanding various aspects of a dataset. For example, you can learn about statistical properties, types of data, the presence of null values, the correlation among different variables, etc. But to get these details, you need to use different types of Python methods and write multiple lines of code.
What if there’s some tool or library that can help you understand all these properties from a dataset with a few lines of code and with less complexity? Well, you’re in luck. The pandas profiling library from Python can help you get all this information in detail with very little effort.
In this post, you’ll learn about the pandas profiling library with examples, best practices, and practical implementation on how the library extracts more information out of your datasets in the real world.
Pandas profiling is a Python library that generates interactive HTML reports containing a comprehensive dataset summary. It automates the exploratory data analysis (EDA) process, saving time and effort for data scientists and analysts.
Pandas profiling empowers users to make informed decisions and accelerate the data analysis pipeline by offering insights into data quality, distribution, relationships, and potential issues. Profiling capabilities are built on top of the pandas library, leveraging its data manipulation capabilities and offering a wide range of features:

Let’s understand the pandas profiling advantage by looking at an example with Python code.
To illustrate pandas profiling’s capabilities, you should consider a hypothetical dataset containing information about meteorites, which is available in pandas profiling itself.
Let’s begin with importing the necessary Python modules:
import numpy as np
import pandas as pd
import requests

from pathlib import Path
from ydata_profiling.utils.cache import cache_file

# load dataset
file_name = cache_file(
    "meteorites.csv",
    "https://data.nasa.gov/api/views/gh4g-9sfh/rows.csv?accessType=DOWNLOAD",
)

df = pd.read_csv(file_name)

# preprocess dataset
df["year"] = pd.to_datetime(df["year"], errors="coerce")

# Example: Constant variable
df["source"] = "NASA"

# Example: Boolean variable
df["boolean"] = np.random.choice([True, False], df.shape[0])

# Example: Mixed with base types
df["mixed"] = np.random.choice([1, "A"], df.shape[0])

# Example: Highly correlated variables
df["reclat_city"] = df["reclat"] + np.random.normal(scale=5, size=(len(df)))

# Example: Duplicate observations
duplicates_to_add = pd.DataFrame(df.iloc[0:10])
duplicates_to_add["name"] = duplicates_to_add["name"] + " copy"

df = pd.concat([df, duplicates_to_add], ignore_index=True)

# generate report
report = df.profile_report(
    sort=None, html={"style": {"full_width": True}}, progress_bar=False
)

profile_report = df.profile_report(html={"style": {"full_width": True}})
profile_report.to_file("/tmp/example.html")
Upon running the above code, an HTML report will be stored in the “temp/” folder. Don’t worry if you don’t understand the code here; we’ll break it down in the upcoming section for better understanding. The generated HTML report will provide a detailed overview of the dataset, including:
The Overview section provides a high-level dataset summary, including the number of rows, columns, and missing values. This information is crucial for understanding the dataset’s size and completeness.
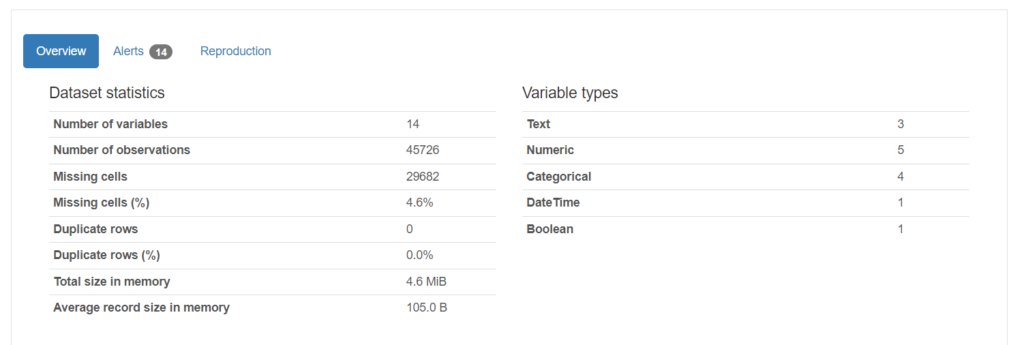
The dataset has 14 columns, more than 45,000 rows, and almost 29,000 missing rows, as shown in the above image.
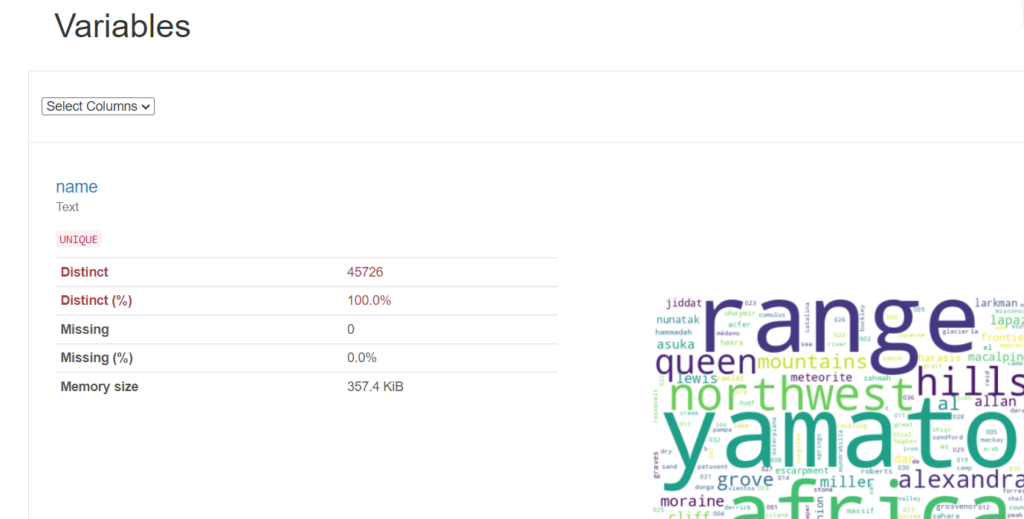
The Variables section offers detailed insights into each column, including data type, unique values, missing values, and statistical summaries. This section helps identify potential data-quality issues, such as inconsistent data types or excessive missing values. You also get the option to choose a particular column from the drop-down menu.
The Correlations section reveals relationships between numerical variables. A high correlation between two variables suggests a robust linear relationship, which you can explore further using scatter plots.
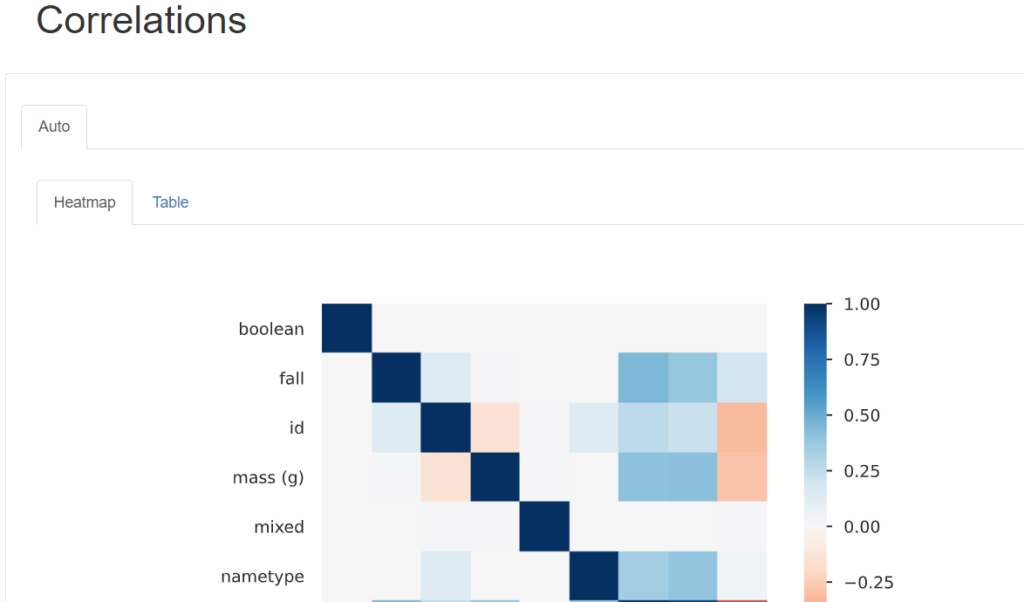
The coefficient near 1 shows a high positive correlation between the two variables, while -1 shows a negative correlation.
The Missing values section visualizes the missing values pattern, helping to identify potential causes and implications for data analysis.
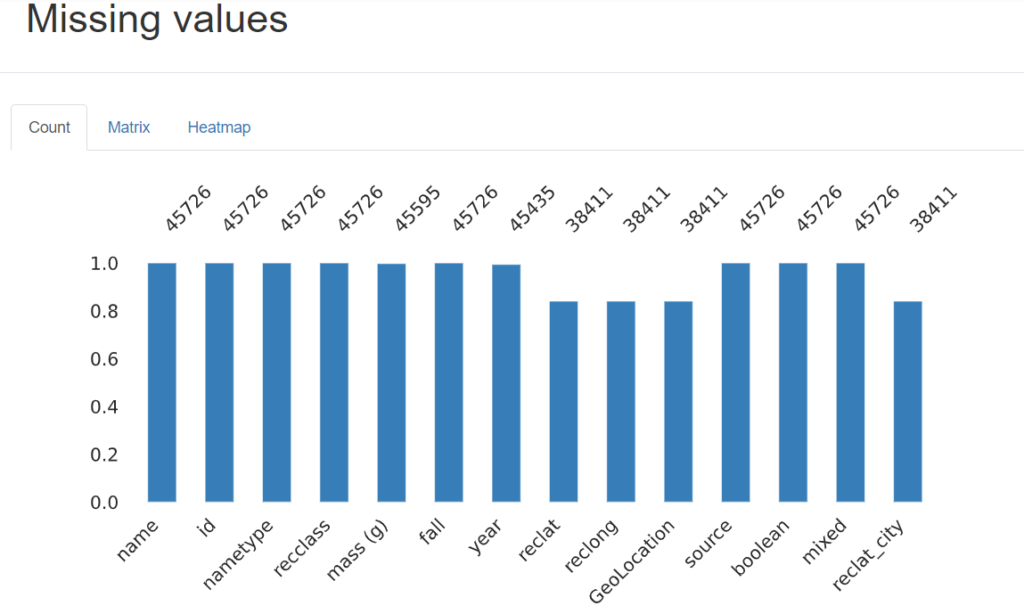
All columns have high missing values, as shown in the image above.
The Sample section provides a random sample of the data, allowing for a quick visual inspection of the data distribution and identifying potential outliers or anomalies.
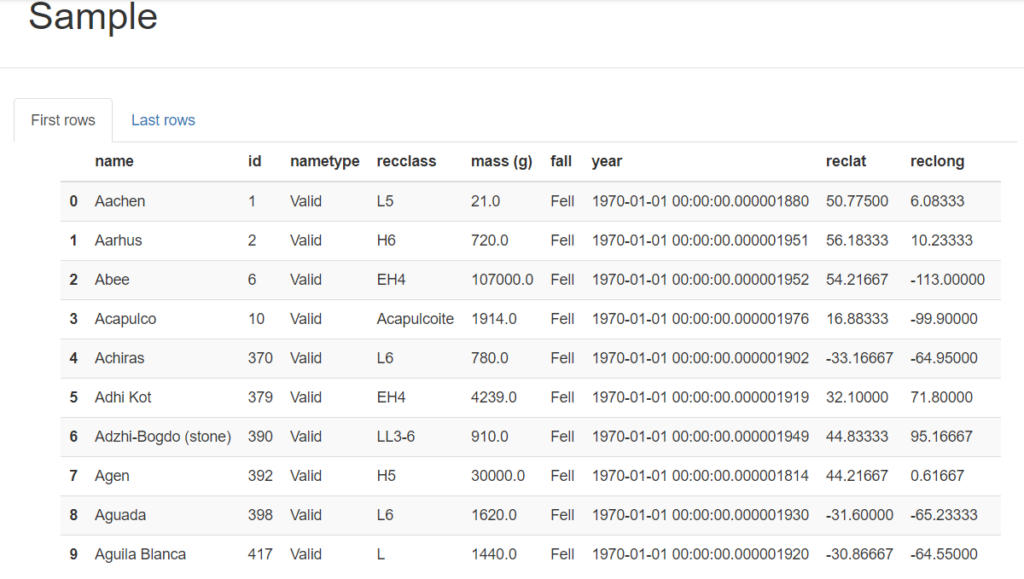
This image shows the first 10 rows of the dataset. However, you also can check the last 10 rows by clicking “Last rows.”
Now, let’s go through the steps to work with the pandas profiling installation to generate and analyze the report.
The pandas profiling project setup requires you to install pandas profiling with other libraries.
You need to install the following libraries to work with the project to use pandas profiling:
To install pandas profiling, use the following command:
!pip install pandas-profilingAfter installing the necessary libraries, be ready to play with some Python code to perform analysis quickly.
Before generating a profile, load your data into a pandas DataFrame and clean the dataset to perform the EDA using pandas profiling.
# define filename
file_name = cache_file(
    "meteorites.csv",
    "https://data.nasa.gov/api/views/gh4g-9sfh/rows.csv?accessType=DOWNLOAD",
)

# read dataset
df = pd.read_csv(file_name)
Here, the read_csv() function from the pandas library is loading the CSV file as a dataframe.
Create a profile report using the pandas function (an implementation of pandas profiling).
report = df.profile_report(
    sort=None, html={"style": {"full_width": True}}, progress_bar=False
)
report
Here, the profile_report() function creates the profile report of the dataframe.
Now that you’ve generated the report using basic features, you should be curious about what more you can do with pandas profiling. This section provides more advanced usage of pandas profiling to overcome your curiosity.
Pandas profiling offers several options for customizing the report:
For large datasets, consider using the explorative=False option to improve performance. Additionally, you can sample the data before generating the profile to reduce processing time.
Pandas profiling can be integrated with other tools and libraries to enhance the functionality. For example, you can embed the report in a web application framework like Flask or Django.
Reports provide valuable insights into data quality, distribution, and relationships. Here are some key considerations:
The code used in this article can be found here.
Pandas profiling is a powerful tool for accelerating data exploration and analysis. You can use it to:
Developers can leverage pandas profiling to:
Pandas profiling has been used across various industries, including:
You can also check out some fascinating applications of Python where pandas profiling can be used.

To maximize its benefits of this valuable tool, which can significantly enhance data exploration quality and understanding, consider the following best practices:
Employ immediately upon data ingestion to establish a baseline understanding of the dataset’s structure, quality, and potential issues. Also, you can utilize pandas profiling as a foundational tool for EDA, uncovering patterns, anomalies, and relationships within the data.
Incorporate generated reports into version control systems (e.g., Git) to track data quality and distribution drift over time. Additionally, you can integrate pandas profiling into continuous integration and continuous delivery (CI/CD) pipelines to ensure data-quality checks are automated and consistently applied.
Establish a consistent reporting format using to facilitate effective collaboration and knowledge sharing among team members. Moreover, document the insights you discovered from pandas profiling reports to provide valuable context for future analysis and model development.
Re-run frequently on updated datasets to monitor data characteristic changes and identify potential issues. Additionally, as the project progresses, consider refining the pandas profiling configuration to focus on specific areas of interest or to optimize performance for larger datasets.
While pandas profiling is a valuable tool, it has some limitations:
Several alternative tools offer similar functionalities, including:
When choosing a profiling tool, consider the size of your dataset, the level of customization required, and the specific insights you need to extract.
Pandas profiling is being renamed to ydata-profiling with version 4.0, focusing on performance and flexibility.
For more advanced tips and best practices for monitoring all your Python applications, check out Stackify’s guide on optimizing Python code. Better still, start your free trial of Stackify Retrace today and see how full lifecycle APM helps you maintain code quality and performance when using Python or any other programming language.
Pandas profiling is an essential library for data scientists and analysts to explore data efficiently and a valuable tool for developers of finance, health care, marketing, e-commerce, and other applications benefitting from data analysis. A comprehensive dataset overview accelerates the data analysis process and enables informed decision-making.
By effectively utilizing pandas profiling, you can improve the quality and efficiency of your data-driven application development projects. You’ll also gain a significant advantage in your data-driven projects by mastering pandas profiling. Moreover, you can improve data quality and build robust data-driven applications by leveraging the profiling insights you get.
Stackify's APM tools are used by thousands of .NET, Java, PHP, Node.js, Python, & Ruby developers all over the world.
Explore Retrace's product features to learn more.


