Software applications have the potential to create an amazing amount of data that can be used to monitor them and troubleshoot problems. Although, the most important things to monitor are not always performance related. Sometimes it makes sense to create custom metrics to help track the behavior or very specific performance issues.
We use custom metrics at Stackify for a wide array of issues. They are very helpful for tracking usage over time to correlate to performance or potential spikes in traffic. In this article, we are highlighting some examples of how we use custom metrics to give you some ideas on how they could help you.
Our Retrace product has excellent support for a wide variety of metrics. Including basic server metrics, Windows Performance Counters, and JMX MBeans. We also have APIs available for .NET and Java that can be used to create custom metrics with just a couple lines of code. Our libraries handle aggregating all of the metrics together and reporting them to Retrace with little to no application performance overhead.
Check out our documentation to learn more: Custom Metrics Overview
I’m sure there are several more types of custom application metrics than three. But for the purpose of this post, I am going to focus on the most common three:
Sometimes it is important to know how often a certain event happens. If that is a one to one relationship with how often a certain request in your web application happens, you may be able to base it off that alone.
We have a lot of back end processes that read messages from a queue. How do we track how many messages per minute we are processing? Custom metrics works perfectly for this.
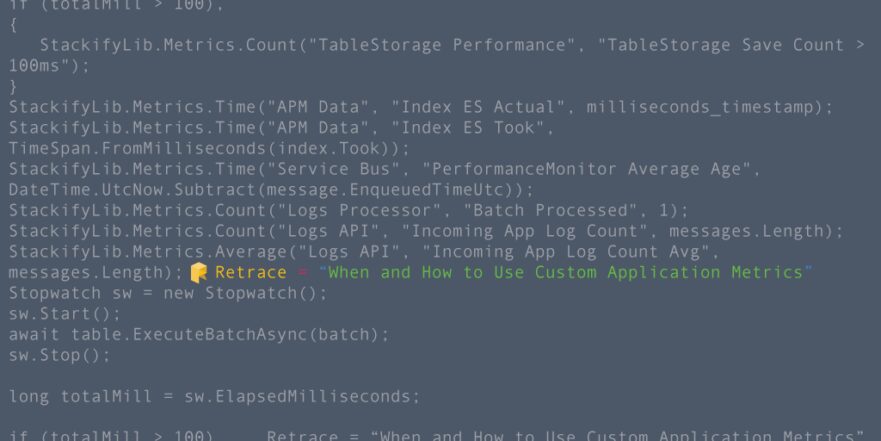
StackifyLib.Metrics.Count("Logs Processor", "Batch Processed", 1);
So, we know how many times per minute this API action gets called, but what if we wanted to track how many log messages are uploaded? It could be any number included within the request. By summing up the total number it gives us a better idea of the volume of data we are ingesting.
StackifyLib.Metrics.Count("Logs API", "Incoming App Log Count", messages.Length);

Instead of a count, we might also want to do an average. This would tell us how many messages on average we receive each time.
StackifyLib.Metrics.Average("Logs API", "Incoming App Log Count Avg", messages.Length);
When data hits our APIs we usually queue it to Azure Table Storage. One of the things we do in our code tracks how long it takes to write to Azure Table Storage. We then report some different metrics based on the timing. This allows us to potentially configure monitoring based on these and understand over time how often writing to Azure is slow.
Stopwatch sw = new Stopwatch();
sw.Start();
await table.ExecuteBatchAsync(batch);
sw.Stop();

long totalMill = sw.ElapsedMilliseconds;

if (totalMill > 100)
{
   StackifyLib.Metrics.Count("TableStorage Performance", "TableStorage Save Count > 100ms");
}

If your application is like most, it probably has some places in it that do a bunch of different activities as part of a larger transaction. Custom metrics can help you track times of those individual activities or pieces.
In parts of our code we process batches of application logs, metrics, and other data. Some of it is stored in Elasticsearch. As part of the processing, we may run multiple SQL statements, access cache, and many other steps. Custom metrics allow us to track within that larger process how much of the time was spent on Elasticsearch.
StackifyLib.Metrics.Time("APM Data", "Index ES Actual", milliseconds_timestamp);
We can go one step further though and also take the “took” time that Elasticsearch responds with and also record that. Then we can compare the total wall clock time that our code experienced to the time “took” time being reported back.
StackifyLib.Metrics.Time("APM Data", "Index ES Took", TimeSpan.FromMilliseconds(index.Took));
We use a lot of back end services that process messages from a queue. These operations are critical to us. With a couple lines of code, we can track how often on average it takes to process each message.

We process a lot of messages off of queues. Another good use for custom metrics is tracking the average latency of those messages. That gives us an idea of how old the data is we are processing and how fast our end-to-end throughput is.
StackifyLib.Metrics.Time("Service Bus", "PerformanceMonitor Average Age", DateTime.UtcNow.Subtract(message.EnqueuedTimeUtc));
In this example, we can see the average age of the message is 329 milliseconds. Not bad at all!

Depending on your type of application, gauge metrics are perhaps the least likely for you to use. A good example of these types of metrics are the gauges on your car dash. Your speedometer is always a single number. You are simply changing it as needed over a period of time.
Gauge metrics are really common in application frameworks. Things like current # of SQL connections, server CPU, garbage collection stats and similar metrics.
So when would you use a gauge style metric?
As mentioned before we do a lot of queue based processing. If we wanted to know how many concurrent messages we are processing at a time, we would want to use a gauge type metric. We would increment it when we start processing a message and then decrement it back down when we are completed.
This type of example is similar to tracking the current number of connections to something.
We also use this within our Quartz job scheduling to know how many jobs are executing concurrently.
Retrace makes it easy to track custom metrics for .NET and Java applications. With Retrace, you can track basic server metrics, application framework metrics, your own custom application metrics and much more! Retrace combines code-level performance, application logs, errors, and metrics in one easy to use service. Retrace starts at just $10 a month!
Learn More:
Stackify's APM tools are used by thousands of .NET, Java, PHP, Node.js, Python, & Ruby developers all over the world.
Explore Retrace's product features to learn more.


