Performance profilers mainly aid developers in analyzing the performance of applications. The purpose is to improve poorly performing sections of code that make up the functions of the application. When you say performance profilers, common names that come to mind are Visual Studio performance profilers and Prefix by Netreo.
In this article, we will focus on the specific Visual Studio profiling tools for memory and CPU usage.
Visual Studio (VS) is an integrated development environment (IDE) used for many software development aspects and includes a suite of profiling tools. The VS performance profiler is like a world of its own with multiple performance profiling tools for troubleshooting issues and improving application performance.
If you want to learn more about the different VS performance profiling tools, read about the Top Visual Studio Profiling Tools.
Two of the most commonly used tools within the suite are Memory Usage and CPU Usage tools, because a slow application typically results from memory and CPU issues. Though it does not apply at all times, these two are the most common culprits.
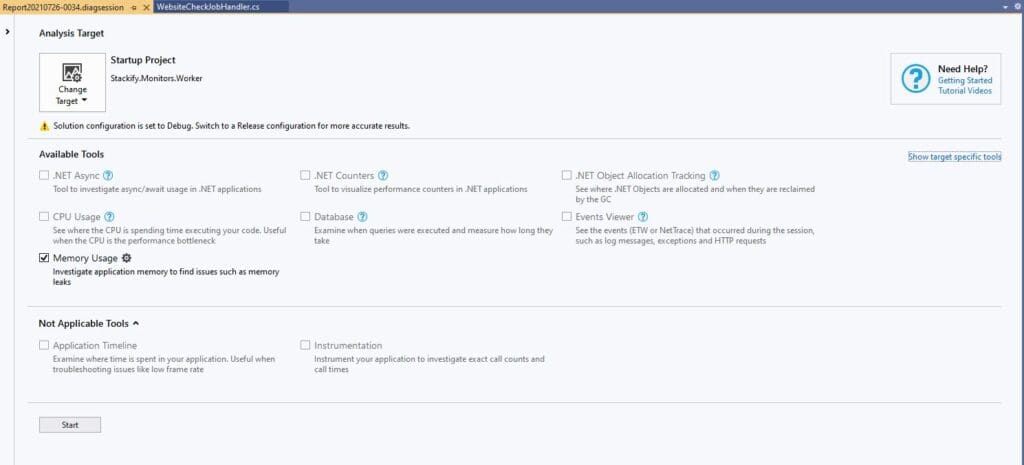
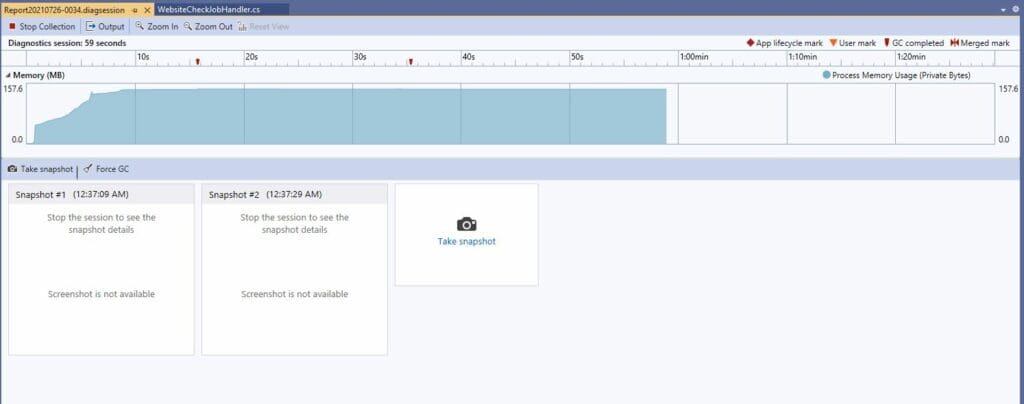
Memory profiling tools are essential when profiling application performance. For the VS performance profiler, the Memory Usage tool is your go-to tool. The Memory Usage tool runs smoothly with .NET Core-managed scenarios and is best in locating memory leaks, code pathways allocating a lot of memory and many other issues.
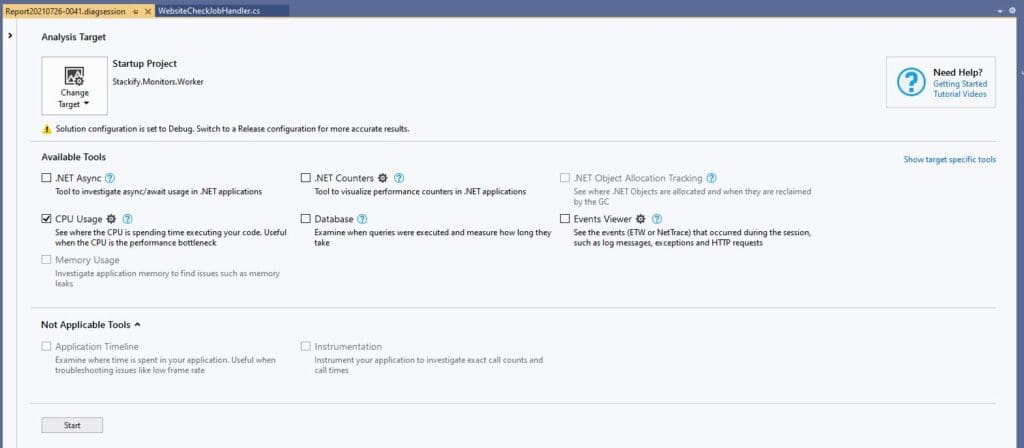
The CPU Usage tool is another staple for VS and measures two basic things. First is the percentage of CPU utilization over time or the percentage of your total CPU usage. The second is the number of times a call to action function appears on the call stack over time.
Within the Visual Studio performance profiler you will find profiling tools such as CPU Usage, Database, Events Viewer, Memory Usage, dotNET Object Allocation Tracking, .NET Async, .NET Counter and GPU Usage. Let’s take a closer look at troubleshooting with our two key usage tools.
The Memory Usage tool runs with or without a debugger. When using the Visual Studio performance profiler, you will run without a debugger. Profiling and troubleshooting with the Memory Usage tool is recommended mostly for release builds.

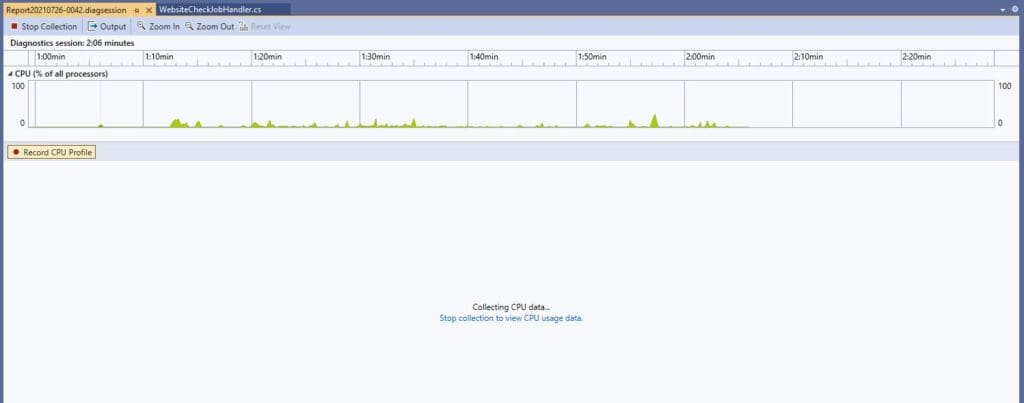
There are two main actions to take when troubleshooting using the CPU Usage tool: data collecting and analyzing.
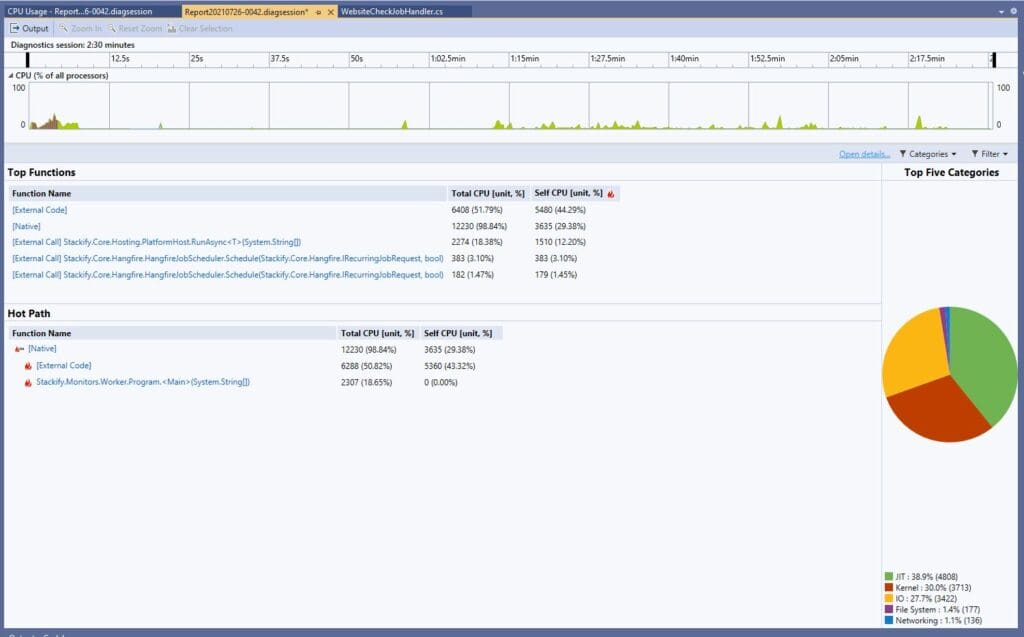
The above image shows the CPU Usage data report. You can see two groups: Top Functions and Hot Path. Under Top Functions are application functions that are taking up a lot of the CPU. The Hot Path shows areas of the code that also use a lot of the CPU’s resources. Through these reports, developers can pinpoint which areas should be optimized.
When you click on one of the functions under the functions table, it displays a flat list of called functions but does not show the path of each function. To view the call tree of the report, navigate the Current View dropdown at the upper left corner of the page, select Call Tree.
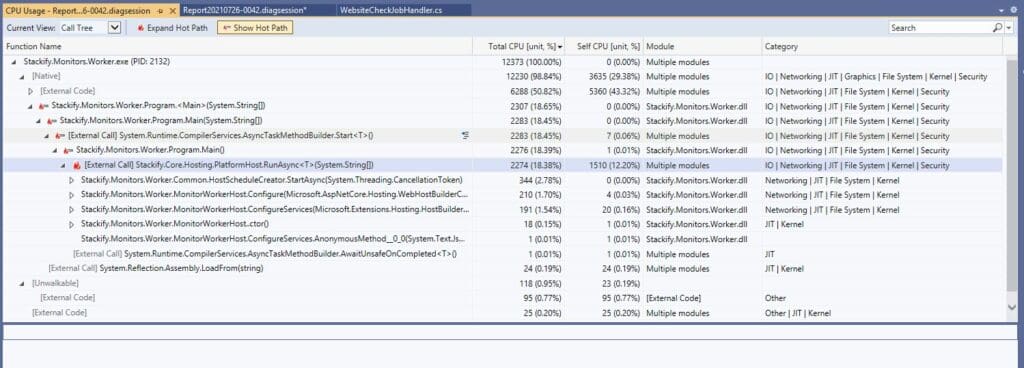
The flat list instantly changes to the image above. When you click on a function, it shows you the path and views of what transpired during the system execution. You can see the cause of performance issues and whether they stem from the native code, external code or other scenario.
Memory Usage and CPU Usage tools are essential for basic performance profiling. However, these are not the only tools for performance profiling. You can find more in-depth tools that will give you more granular data for troubleshooting application performance.
Besides Visual Studio tools, you can also find other reliable code profiling tools that can efficiently help you, including the developer’s most reliable sidekick, Prefix.
Prefix is one of the world’s most dynamic code analysis tools. Profiling with Prefix can help even the most experienced developers when it comes to optimizing slow SQL queries, hidden exceptions and a host of other code issues. What’s better is that it works for PHP, .NET Core, Python, Node.js, Java and Ruby.
You don’t have to face another coding nightmare because Prefix can quickly back you up. DOWNLOAD PREFIX FOR FREE TODAY!
Stackify's APM tools are used by thousands of .NET, Java, PHP, Node.js, Python, & Ruby developers all over the world.
Explore Retrace's product features to learn more.


