
Having IIS performance problems? Do you have w3wp.exe high CPU usage? How do you troubleshoot IIS Worker Process High CPU usage?
In this post, we’ll discuss some tips to identify what’s causing high CPU usage for your ASP.NET web applications.
There are a lot of reasons that your IIS worker process (w3wp.exe) could be using a lot of CPU. We’ll cover some of the top reasons and how to troubleshoot IIS performance problems.
To start, you should look at which web requests are currently executing with IIS to see if that helps you identify the issue to be able to troubleshoot IIS worker process.
One of the first things you should do is see which web requests are currently executing. This may help you identify a specific URL that is causing the problem.
There’s a chance that you could recognize one of the URLs that’s known to take a very long time or cause high CPU issues.
Although, this may also show a bunch of web requests that are queued up and not directly lead you to the root cause.
Also Read-https://stackify.com/kubernetes-in-production-6-key-considerations/
Via the IIS management console, you can view the running worker processes. You can view which IIS application pool is causing high CPU and view the currently running web requests.
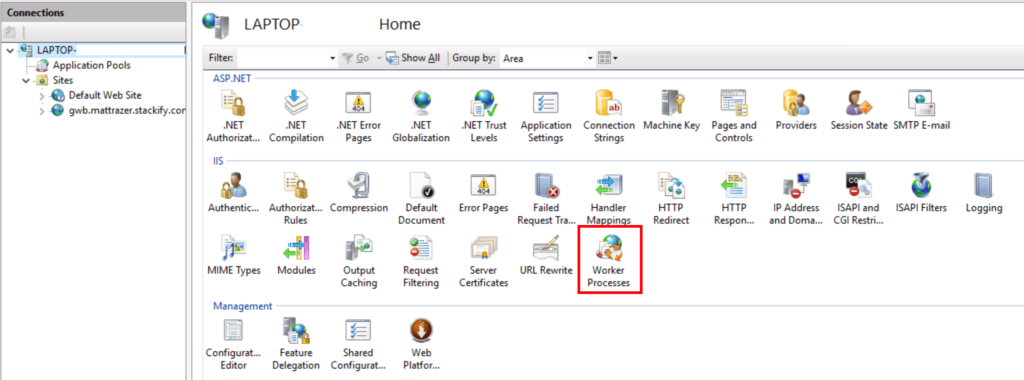
After selecting “Worker Processes” from the main IIS menu, you can see the currently running IIS worker processes.
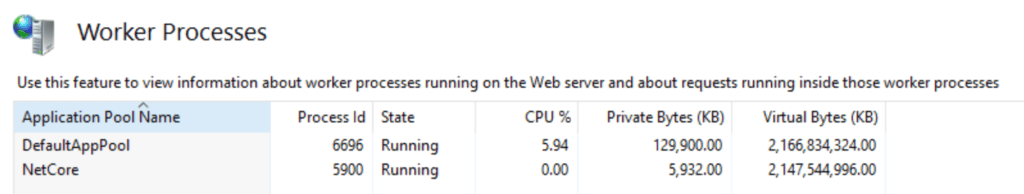
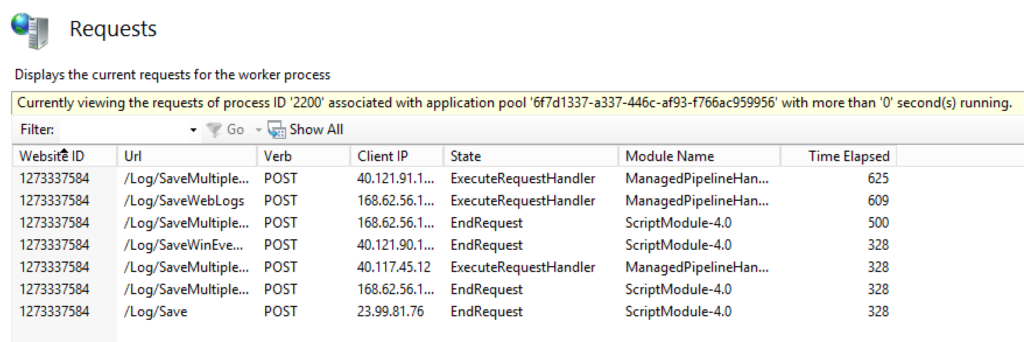
If you double-click on a worker process, you can see all of the currently executing requests.
Here’s an example from one of our servers. You can see that each request is in different parts of the ASP.NET pipeline and currently executing different HTTP modules.
The appcmd.exe utility can be useful for a lot of things, including the currently running web requests.
C:\Windows\System32\inetsrv>appcmd list requests
REQUEST "f20000048000021c" (url:GET /nopcommerce, time:6312 msec, client:localhost, stage:BeginRequest, module:IIS Web Core)
You can view the currently executing web requests via the IIS user interface or command line. Either way, it returns the same information.
There are a lot of reasons that you can be seeing w3wp.exe IIS Worker Process high CPU usage. I have selected six common causes to cover in this post:
Application errors could be happening in your application, and you don’t even know it. Some errors will cause your users to receive an error message of some form. Other errors may happen, and nobody knows about it.
If you are using an error monitoring or application performance management tool, be sure to check those for high error rates.
There are a few places you can look for application error rates and actual errors, including Windows Event Viewer, IIS Logs, and more. Read this article to learn more: IIS Logs, Error Logs and More – 6 Ways to Find Failed ASP.NET Requests
There are two specific performance counters I would recommend reviewing for high error rates. You can check these by opening Performance Monitor within Windows and adding the counters to the chart view.
One of the simplest explanations for w3wp.exe high CPU usage is an increase in web traffic. However, if you don’t have any baseline for what your normal volume of traffic is, it can be hard to know if traffic has increased.
If you are using some application monitoring tool that tracks the traffic, be sure to check it and see if traffic levels have changed.
If you don’t have any way to know if traffic levels have changed, you could use your IIS log files to try and find out.
You can use VisualLogParser or Log Parser Lizard to query them.
Related tutorials:
Analyze your IIS Log Files – Favorite Log Parser Queries (VisualLogParser)
Tutorial for Log Parser Lizard GUI
There are also windows performance counters for Requests / Sec and Requests Current to see the current traffic rates in real time.
If traffic levels are up, you should evaluate if it should be or not. Here some things to think about in regards to increased traffic levels:
If your site is receiving a lot more traffic, you may need to get a bigger server (scale up) or more servers (scale out).
But if your site doesn’t get very many requests per second, traffic may not be the problem.
Many ASP.NET applications have 10-30 requests per second. However, I have also seen lightweight web requests on busy apps doing over 100 requests per second.
The volume of traffic from one web app to another and the related CPU usage varies wildly. It’s all about your specific application.

Using an APM solution, like Retrace, can help you track performance over time of your entire application. It can also tell you which specific web requests take the longest.
APM tools use .NET profilers and other data collection techniques to understand the performance of your application down to the code level.
By identifying which web requests are taking the longest, you may be able to identify your high CPU issue or identify parts of your application that could use some performance review to improve.
Read more: Application Performance Management Solution with Retrace Code Profiling
Today’s web applications leverage a lot of different types of external services and dependencies. Including SQL, NoSQL, queuing, caching, and many external HTTP web services.
Slowdowns from any application dependency can cause performance problems with your application.The most common problems are slow SQL queries or problems with external HTTP web services.
Tracking the performance of your application to this level requires an APM tool, like Retrace. Retrace tracks the performance of your application down to the code level. It can help you quickly identify slow SQL queries, web service calls, and much more.
Also Read-https://stackify.com/new-release-stackifys-prefix-v3-0/
Microsoft .NET utilizes garbage collection to manage the allocation and release of memory.
Depending on what your application does, the allocation and cleanup of application memory can cause a lot of garbage collection activity. For example, the usage of lots of large string variables on the large object heap causes garbage collection problems.
To measure if garbage collection could be causing problems for your application, check this Windows Performance Counter:
.NET CLR Memory -> % Time in GC: This counter reflects what % of the time your application spends doing garbage collection. If this number spikes a lot above 5-10%, you want to investigate memory usage further.
Garbage collection also has two modes. You may need to enable server mode, which is not the default.
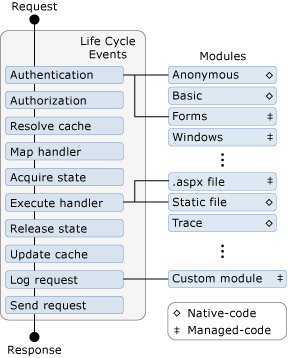
There are many steps in the lifecycle of an ASP.NET request. This includes basic steps like the start of the request, authentication, authorization, evaluating the correct HTTP handler and finishing the request. As part of this, there are many standard and custom HTTP modules that may be in use.
The first thing I showed you was how to view the currently executing web requests.
If you are having performance problems, I would suggest looking to see if all the requests seem to hang on a specific HTTP module.
HTTP modules can be native code or managed .NET code. They can be standard .NET modules like FormsAuthenticaion or SessionStateModule. Many applications also use 3rd party or custom HTTP modules.
Most people don’t realize how much of a performance overhead ASP.NET sessions cause.
On every page load, they cause your IIS worker process to retrieve your session object, lock it, and then release it at the end of the request.
Sessions cause locking and can cause a bottleneck within your application.
If you are using a session provider like Redis or SQL, any performance slowdowns will impact the performance of your application.

If none of the other common causes was a problem, you might need to dig into the code to make improvements. You will need to use .NET code profilers to capture what methods are being called in your code and how long they take.
Profilers can help you identify specific methods in your code that are very slow.
Warning: Profilers do add overhead to your application. So if your application already has very high CPU usage (90+%), profiling will be very slow, and the performance of your application will get worse.
This could make your application unusable even depending on the detail level of profiling you are doing and the CPU usage before you started profiling.
My favorite .NET profiler is RedGate’s ANTS Performance Profiler. They do offer a free trial that you can take advantage of.
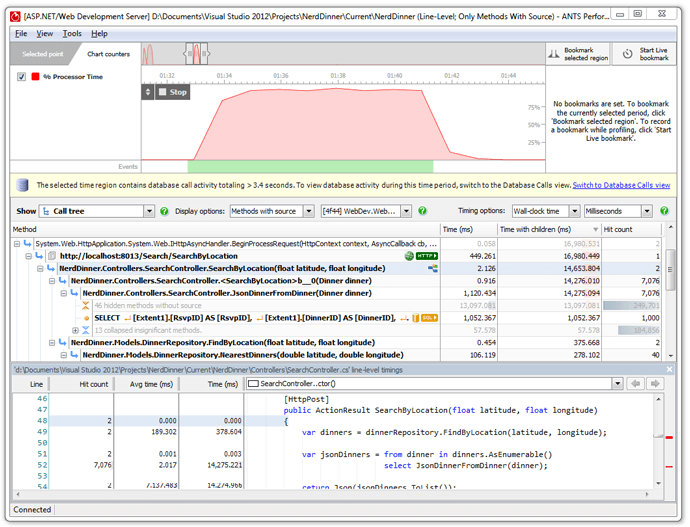
Check out these articles to learn more about ANTS and how to profile ASP.NET applications.
How to Troubleshoot High .NET App CPU in Production With ANTS and Process Hacker
Walkthrough: ASP.NET profiling with ANTS Performance Profiler
Hopefully, you are reading this because you are trying to figure out how to improve performance. I hope your server isn’t at 100% and you are scrambling!
As a provider of APM solutions, we spend a lot of time working on and thinking about application performance problems. We hope this guide has been helpful to troubleshoot IIS Worker Process (w3wp.exe).
Stackify's APM tools are used by thousands of .NET, Java, PHP, Node.js, Python, & Ruby developers all over the world.
Explore Retrace's product features to learn more.


