One of the biggest nightmares for all developers is to debug their code. Debugging code written in Java is a tough task. Debugging is the process of determining and fixing bugs or errors present in the code, project, or application.
Debugging your application helps you improve the quality of the code. It is a must-have skill for every Java programmer. Debugging also helps you to understand the flow of program code.
This article provides some tips to debug Java program code. We will highlight some common run-time issues and will use the GUI-based Eclipse IDE. There are other IDEs available like IntelliJ, and both IDEs have great support for Java debugging. You can set various line breakpoints, conditional breakpoints, and exception breakpoints. Eclipse also provides support for remote debugging.
So let’s explore these Java debugging tips.
A conditional breakpoint is a better approach if you are working with the Java programming language and debugging your code in Eclipse IDE. Eclipse allows you to use conditional breakpoints in order to remove bugs in the program code. It’s a breakpoint with a specified condition where the thread will stop at the targeted line when it’s true, unlike a line breakpoint.
This code snippet will be used as an example for setting up a conditional breakpoint.
public void demo1() {
    AList<String> li = pList();
    for (int i=0; i<li.size(); i++) {
        System.out.println(li.get(i));
    }
}
You are required to set up a breakpoint on a line inside the loop only when the value of the element li is equal to a specific value. To set up a conditional breakpoint, use the following steps:
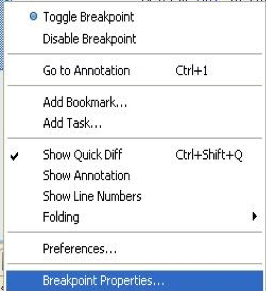
[Note: One thing you need to remember while specifying the condition is that it should return a Boolean value.]
So when the specified condition is true, the program will stop but not otherwise. The program is now executing in the debug mode.
While debugging Java program code in Eclipse, you are often encountered with a NullPointerException error. Sometimes you are not aware of the origin of the error, which can be frustrating.
Developers of Eclipse have provided with a solution for such issues in the form of exception breakpoints. This feature is also available in the NetBeans IDE.
Now you can simply use an exception breakpoint for NullPointerException and ArrayIndexOutofBoundException.
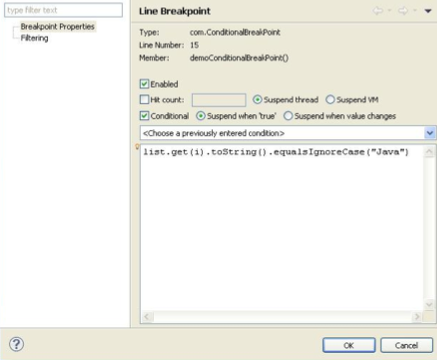
The exception breakpoint can be easily set up from the breakpoint window.
Figure 3 shows the breakpoint window.
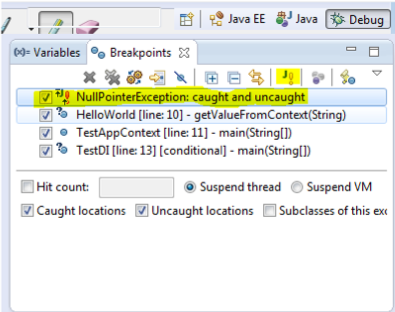
You can see that there is a button labeled J! in the breakpoint window. This button is used to put an exception breakpoint in the program code. The execution of the program will stop whenever the specified exception occurs.
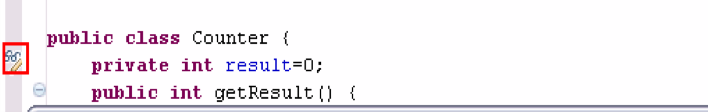
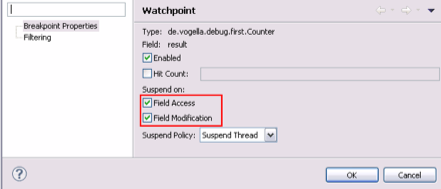
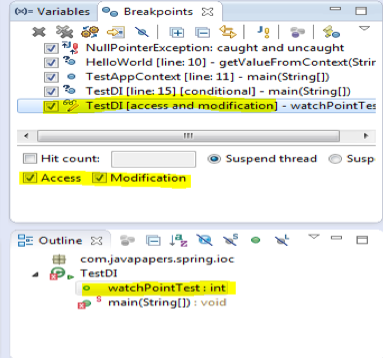
The watchpoint is a breakpoint set up on a field or variable. It is the best feature of the Eclipse IDE. Each time the targeted field or variable is accessed or changed, the execution of the program will get stop and then you can debug.
The following steps will help you to set up a watchpoint:
While performing Step Into during debugging process, sometimes it happens that the control of the program goes from one class to other class and eventually, you are moved to the external libraries or JDK classes like System or String.
In case you do not want to move to the JDK classes or external libraries, then step filtering is used. It will help you to filter out the JDK classes from Step Into. This feature will assist you in skipping some particular packages during the debugging process.
You can easily set up step filtering with the following steps:
A window will appear on your screen as shown in Figure 7.
Later, if you want to enable or disable the step filtering option, you can do it from the Debug window.
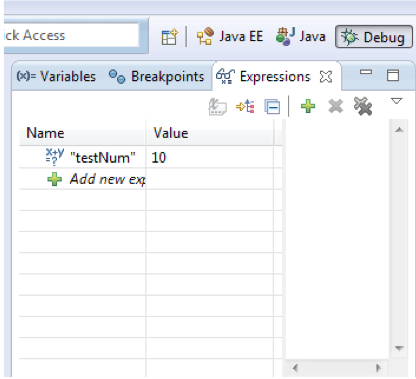
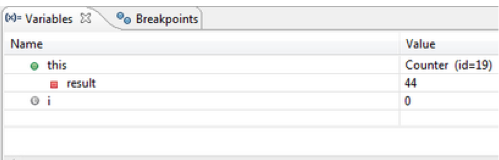
This is another good feature of the Eclipse IDE. This feature will enable you to check the value of expressions while debugging Java programs. All you need to do is right-click the statement and click on inspect. It will show you the value of the selected expression during the debugging process. The value will appear in front of you over the watch window.
Figure 8 illustrates the image of the watch window in which the value of an expression is displayed.
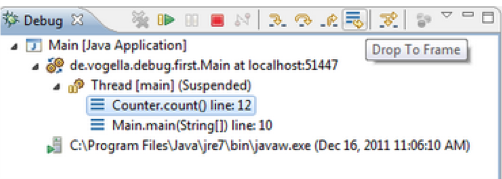
Eclipse enables users to choose any frame (level) in the call stack during the debugging process and set the JVM to start again from the selected level. In simple words, it allows you to re-run a part of your program.
[Note: The changes made to the variable will not be reset.]
The following steps will help you use this feature:
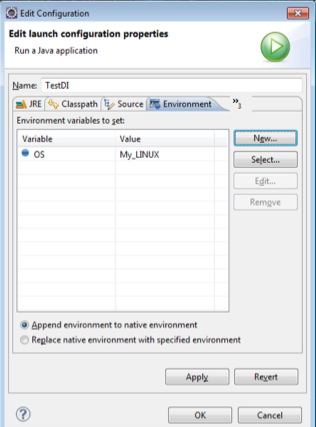
As you know, it is important to set up environment variables prior to coding in Java. We all are aware of how to set up environment variables. We need to go to the system properties in order to add an environment variable. Eclipse allows you to do it from the IDE itself.
There is no need to follow the traditional path to set the environment variables. You can easily do the same through Edit Configuration dialog box.
Figure 11 shows the image of the Edit Configuration dialog box.
It is not easy to check the values of a map or a list with the default settings of the Eclipse. You need to edit them or choose another way.
The logical structure option is very useful, especially when trying to determine the contents of Java collection classes such as HashMap or ArrayList. Instead of displaying the detailed information, the logical structure will present only the necessary content such as the key and value of a HashMap.
You can easily enable the Show Logical Structure option with the help of a button. This option is very handy, especially if you don’t have meaningful toString() methods for the objects in your structure.
Figure 12 displays the position of show logical structure button.
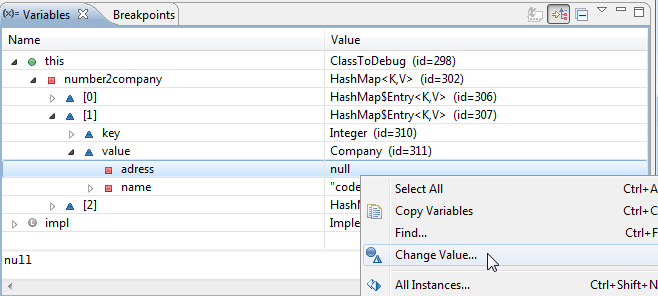
Eclipse allows you to change the values of variables during the debugging process. There is no need to restart your debugging session with minor changes in the code. You can continue to debug the program code. It will save time.
Figure 13 shows how to change the value of a variable.
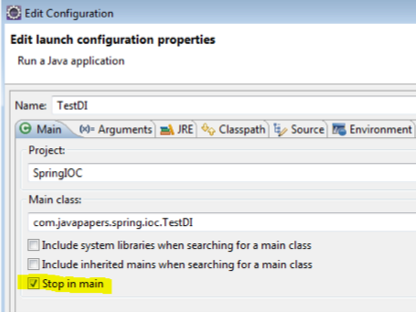
This feature is present in the Edit configuration window of the Debug settings. When a program is debugged with this feature enabled, the execution will stop at the first line of the main function.
In order to enable this feature, open the Edit configuration window and mark the checkbox which states stop in main.
Figure 14 illustrates how to enable the stop in the main feature.
Apart from the above-mentioned tips, I’ve listed some common tips below.
Stackify’s Dynamic Code Profiler makes it easy to debug your Java code to find bugs you didn’t know existed. Download for free today!
Stackify's APM tools are used by thousands of .NET, Java, PHP, Node.js, Python, & Ruby developers all over the world.
Explore Retrace's product features to learn more.


