APM refers to application performance management or application performance monitoring and is an essential tool to help optimize and monitor the performance of your apps.
You could argue that application performance management and application performance monitoring are the same things. Conversely, it could be argued that management infers being more proactive and monitoring only being reactive when it comes to the performance of your application. What is Application Performance Management (APM)?
For my definition, APM, or application performance management, is largely an industry or vendor created term for anything that has to do with managing or monitoring the performance of your code, application dependencies, transaction times, and overall user experiences.
Since APM is sort of a ubiquitous term for anything and everything performance-related, some vendors use the term to mean totally different things. APM can span several different types of vendor solutions.
Some other tools do monitor based on server and application metrics, not code-level performance, and sometimes refer to their products as application performance monitoring solutions. Knowing your server CPU or average response of your webserver is important and helpful, but APM aims to go way deeper.
By leveraging code profiling and other data collection techniques, application performance monitoring tools can provide detailed transaction tracing.

Full Transaction Tracing in Stackify Retrace
APM is all about understanding the “why” as fast as possible
If you want to measure the performance of a web application, it is pretty trivial to parse the access logs and get an idea of how long web requests take. This would give you an idea about overall performance and which pages are slow. Unfortunately, it doesn’t answer the key question of why.
The heart of APM solutions is understanding why transactions in your application are slow or failing.
For example, a development or operations team can instantly tell from this visual that their database is causing some performance spikes. They can also leverage their APM to identify exactly which database query and web requests were affected.

APM solutions can help identify common application problems quickly:
See why developers love using Retrace to proactively find and fix APM issues. Book a demo today.
For developers, APM is really all about data, and I mean lots of data. But they need more than data, they need actionable insights from that data so they can quickly get to root cause of what is causing application problems.
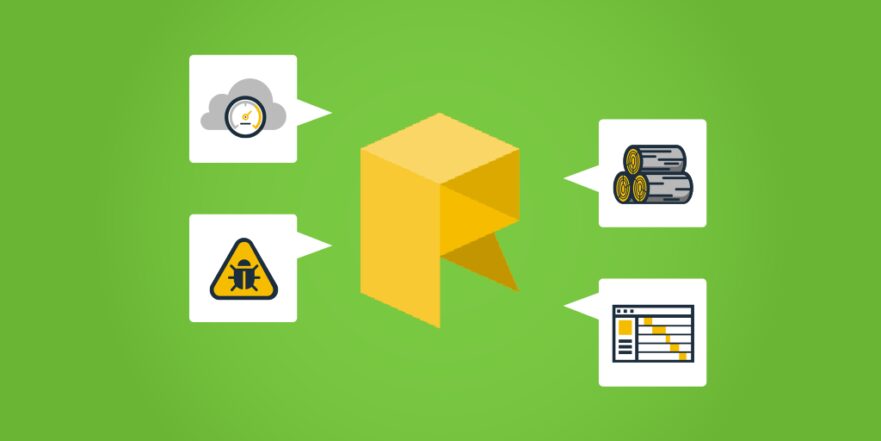
Here are some of the key features that most of them support.
At the heart of APM you have to be able to measure the performance of every web request and transaction in your application. You can then use this to understand which requests are accessed the most, which are the slowest, and which ones you should add to your backlog to improve.
Knowing the performance of every web request is just the start though. You could potentially get that from a web server access log. The real key is understanding why.
If you want to understand why your application is slow, throwing errors, or has weird bugs in it, you have to get down to the code level. Knowing that a certain web request doesn’t work is important and actually pretty easy. Figuring out why it doesn’t work is hard, sometimes really hard.
By tracking what your application is doing all the way down to the code level, you can potentially gain way more insights about what is occurring:
Why your application is slow usually comes down to a spike in traffic or a problem with one of your application dependencies.
It is very common to have these types of problems:
As one example, we recently had some issues accessing Hubspot’s API. They were throttling us and the only way we would have ever known is because track all of the exceptions and can see in our APM that those affected transactions were also failing.
Troubleshooting problems in production are very difficult. Transaction traces makes this a lot easier by being able to see details about exactly what is happening in your code and how that affects your users.
Traces can contain these types of data:
Seeing all of this data in a single trace can short circuit having to attempt reproducing a problem in QA. Getting to root cause can be nearly instantaneous with an APM solution that collects details traces.
Application problems can occur for a lot of reasons. Thanks to virtualization and the cloud, a server going down aren’t near as common these days. However, it still does happen and is something you need to monitor for. It is also critical to monitor things like server CPU and memory. A lot of modern web applications are not usually CPU bound but they can still use a lot of CPU and it is a useful indicator for auto-scaling your application in the cloud.
Server metrics like CPU and memory are interesting, but for developers, application metrics can be a lot more valuable for true application performance monitoring. Developers need to monitor metrics around things like garbage collection, request queuing, transaction volumes, page load times, and much more. Developers can monitor a wide variety of Windows Performance Counters and JMX MBeans. It can also be critical to monitor things like Redis, Elasticsearch, SQL, and other services for key metrics.
Standard server and application metrics can be very helpful for monitoring your applications. However, you may get way more value by creating and monitoring your own custom metrics. At Stackify we use them to do things like monitor how many log messages per minute are being uploaded to us or how long it takes to process a message off of a queue. These types of custom metrics are easy to create and can be very useful for application performance monitoring.
Whenever something goes wrong in production the first thing you will hear a developer say is “send me the logs”. Log data is usually the eyes and the ears of developers once their applications are deployed. Developers need access to their logs via a centralized logging solution like a log management product. Fortunately, log management is an included APM feature in Retrace. Most APM solutions don’t support the #1 thing developers want to see… their logs!
The last thing we ever want is for a user to contact us and tell us that our application is giving them an error or just blowing up. As developers, we need to be aware of any time this occurs and constantly watching for them. Errors are the first line of defense for finding application problems. We need to find and fix the errors, or at least know about them, before or customers call to tell us because odds are most of them won’t even call to tell you. They will just go somewhere else.
Excellent error tracking, reporting, and alerting are absolutely critical to developers in an application performance management system. I would highly recommend setting up alerts for new exceptions as well as for monitoring overall error rates. Anytime you do a new deployment to production you should be watching your error dashboards to see if any new problems have arisen. Odds are, you will find some type of new errors that you can then quickly identify and hotfix.
Understand the performance of your applications on the server side is important. However, today’s applications use so much javascript that it is important to also monitor how long it takes their browser to fully load and render your web pages. A simple javascript error or slow loading javascript file could completely mess up your application. Real user monitoring, or RUM, is another important feature of APM that developers need to fully monitor their applications.
Traditionally, application performance management tools have been an expensive luxury item that only large IT enterprises could afford. Many APM vendors still cater to the larger enterprises, still charging $2,000-$4,000 per year per server. Ouch!
Most APM solutions are very complex to configure and use. So much so that development teams don’t even use them. They end up being expensive traffic lights and dashboards. Some vendors have put a huge focus on making their products affordable and very easy to use so they can be available to the development and operations teams of all sizes. Our product, Retrace, starts at just $10 a month.

Stackify's APM tools are used by thousands of .NET, Java, PHP, Node.js, Python, & Ruby developers all over the world.
Explore Retrace's product features to learn more.


