Monitoring ASP.NET Core with Retrace

Troubleshooting problems with your ASP.NET Core application can be very difficult without the proper tools. With Retrace, monitoring ASP.NET Core performance, viewing logs, and diagnosing specific issues like application errors, slow web requests and database queries all happen in one tool.

Monitoring ASP.NET Core Performance

Retrace tracks the performance of each Core page in your application. Quickly identify which pages are slow, accessed the most and why! Retrace also leverages the industry standard apdex scoring algorithm to make it easy to understand how each of your Core pages are performing. Quickly identify how many users are satisfied, frustrated, and unsatisfied. Apdex is just one of many ways to monitor your ASP.NET Core application with Retrace.

Code-level Performance Tracing

Retrace utilizes lightweight .NET performance profiling to capture detailed tracing about how your applications are performing. Retrace’s detailed traces make it easy to troubleshoot ASP.NET Core performance problems.

Retrace automatically instruments and monitors dozens of common ASP.NET technologies including common databases, Core, WebAPI, asynchronous applications and modern ASP.NET Core applications. Retrace makes it easy to monitor ASP.NET Core applications.

Monitor Slow Database Queries

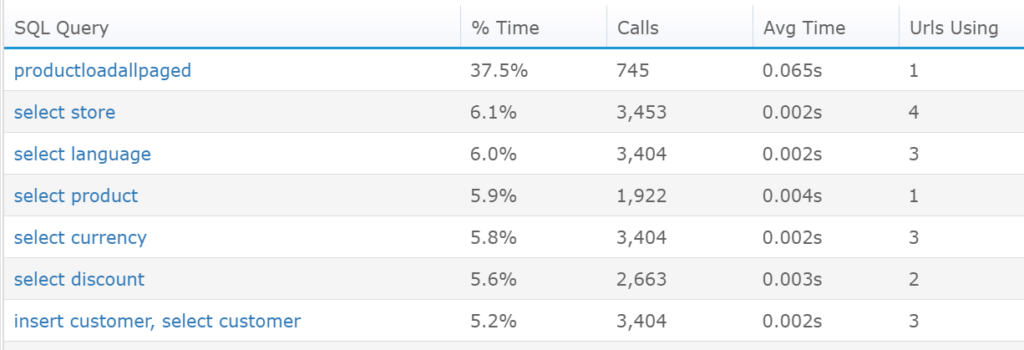
Retrace’s powerful .NET profiler monitors each database query executed by your ASP.NET Core pages. Quickly identify which SQL queries are being executed too many times or take too long to execute. Databases are usually the heart of most modern applications. Being able to monitor and identify database performance problems is mission critical.

Retrace automatically tracks all of the SQL queries being executed by your ASP.NET application. It uniquely identifies each query and removes dynamic data used in the queries.

Identify Slow Dependencies

Modern applications depend on multiple third-party dependencies. Including HTTP web services, Redis, SQL databases, NoSQL databases, queues, microservices and much more. Each of these dependencies can cause dramatic performance problems and bottlenecks to your ASP.NET application. Retraces monitors every dependency used to make it quick and easy to identify performance problems.

Monitor ASP.NET Errors & Logs

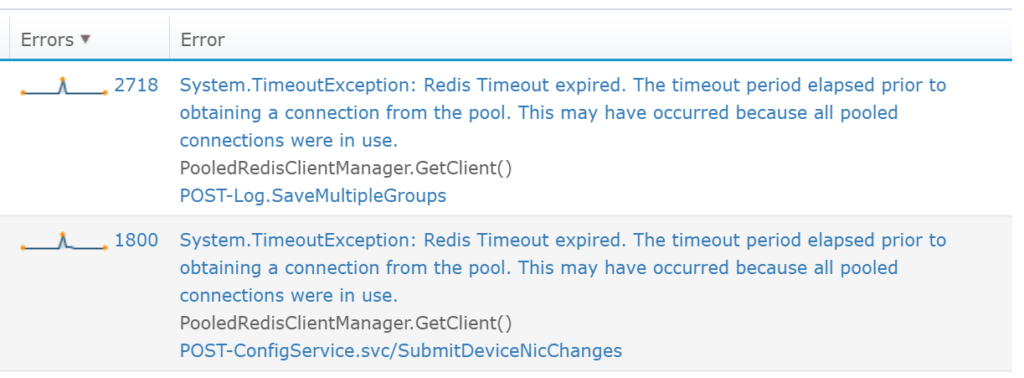
Retrace combines code-level profiling with application logging to gain greater insight into your ASP.NET Core applications. Automatically identify all the errors occurring in your application to quickly identify application problems. Tracking error rates and new exceptions being logged by your applications is fundamental for monitoring any ASP.NET application.

Retrace automatically de-duplicates your exceptions and makes it easy to see what unique exceptions are occurring, how long they have been happening, and much more.

Monitor Your App Score

Retrace offers a proprietary App Score that consolidates four vital application health metrics (user satisfaction, performance, error rates, and server metrics) to produce a holistic, grade card view. Objectively measure which ASP.NET Core apps are underperforming and need attention. An App Score is calculated for each application and environment combination, allowing users to compare scores for the same application across all environments.

Benefits of Monitoring ASP.NET Core with Retrace

Retrace is the only solution available that seamlessly integrates APM, error tracking, and centralized logging in one solution. By using a singular platform, time to resolution is improved without the need to alternate between multiple tools or endless scrolling through log messages to pinpoint an error. Retrace provides comprehensive support for monitoring .NET and .NET Core applications. Including Web Forms, MVC, WCF, Web API, Windows Services, and .NET Core. Retrace can be used to monitor all Microsoft ASP.NET web applications and .NET background services.

Don't Get Left in the Dark

Get Started with Retrace Today.