
Logging provides critical value to applications with insight to usage, stats, and metrics, and saves us when debugging a problem. But we often leave logging to poorly implemented afterthoughts. So what should we know to get the most out of our logging?
We will look at the Rails logger and some logging best practices.
When first learning Ruby, many of us rely on the puts command to log information while debugging code locally. And it is an easy way to get information out quickly. However, that’s where puts’ usefulness usually stops.
When building an application, using a Rails logger or similar gem puts you on the path to proper application logging. To handle logs in a running application, the Rails logger provides additional functionality.
Let’s look at the basic setup of the Rails logger and how to customize it for our needs.
When setting up our Rails logger, we have several options to consider. Here are a few.
In your environment.rb, add the following:
Rails.logger = Logger.new(STDOUT)
config.logger = ActiveSupport::Logger.new("log/#{Rails.env}.log")
Congrats! You have logging. Now if you use Rails.logger.info “Check out this info!” you’ll see the following in your output:
I, [2019-01-04T05:14:33.432311 #123] INFO -- Main: Check out this info!
Of course, we don’t want to just start there. Our default logger logs everything. And that might be a bit much for normal production use. So let’s change that.
Once we realize we don’t want everything logged all the time, we may decide to set our logger level. In fact, we should consider setting different logging levels for different environments. In Rails, we can set different configurations for each environment in our environment.rb files, like development.rb or production.rb. We’ll talk more about logging levels in the best practices section.
Rails.logger = Logger.new(STDOUT)
Rails.logger.level = Logger::DEBUG
If you don’t know what to set as your logging level, don’t worry. Rails has you covered. It defaults to INFO in production and DEBUG in testing and development.
After setting the logging level, let’s improve readability by setting a simple logging format.
First, let’s change the datetime format of the logging messages, continuing on from our configuration above.
Rails.logger = Logger.new(STDOUT)
Rails.logger.level = Logger::DEBUG
Rails.logger.datetime_format = "%Y-%m-%d %H:%M:%S"
After modifying the datetime, we’ll see logs that look more like this:
I, [2019-01-04 05:14:33 #123] INFO -- Main: Check out this info!
As for the message format that gets printed to the log, we have some additional changes we can make. For example, let’s say we don’t like the standard output and would like to mix things up a bit. This can be done in one of two ways—first, with configuration.
As shown below, we’re setting the format specification to show the log message’s datetime and message and the program’s name.
# log formatter
logger.formatter = proc do | severity, time, progname, msg |
    "#{datetime}, #{severity}: #{msg} from #{progname} \n"
end
Alternatively, we can also change the format by overriding the logger’s format method. In this case, we create our own custom formatter class that does the same thing as the example above.
class MyAppFormatter < Logger::Formatter
    def call(severity, time, programName, message)
        "#{datetime}, #{severity}: #{message} from #{programName}\n"
    end
end
Both of these will yield the following log message format:
2019-01-04 05:14:33, INFO: Check out this info! from Main
As a final step, we can also modify the format so it prints out JSON.
class MyAppFormatter < Logger::Formatter
    def call(severity, time, progname, msg)
        %Q | {time: "#{datetime}\n", severity: "#{severity}\n", message: "#{msg} from #{progname}"}\n |
    end
end
This might be helpful when using log aggregators that allow easy querying. The results will look like the following:
{
    "time": "2019-01-04 05:14:33",
    "severity": "INFO",
    "message": "Check out this info! from Main"
}
Now, why switch from just making a configuration change for this logging? Why go the route of creating a formatter class? Well, ultimately, based on your needs you may want to throw in some fancier logic in your formatter. Perhaps you’ll want to log information in a different format based on what’s in the message. Or what severity it is. Using classes makes an easier transition to complex logic for logs.
Before we move on to best practices, I want to make one additional note. When we’re in a Ruby controller or model, we can log by just adding logger.info ‘your message’. But if you’re in a service object or plain old Ruby object, you’ll have to specify the logger, like this:
logger = Rails.logger
logger.info 'your message goes here'
// or
Rails.logger.info 'whatever'
For those of you who’ve been in the Ruby or Rails ecosystem for a while, that may be a no-brainer. But for others, that’s something you may not realize right away. And I want to reduce confusion where I can.
Okay, so now that we know the basics of our Rails logger, what do we need to know next? Well, how about best practices?
Let’s talk more about logging levels. As mentioned earlier, we can set different logging levels for each environment. Typically you’d want more fine-grained logging in environments where you’re actively developing and testing. Production might not benefit from all the noise of debug statements unless there’s an actual issue.
So let’s review the logging levels available and what they mean.
So, when logging messages to yourself or your band of merry developers, make sure to log at the correct level. It will simplify debugging and help reduce log pollution when things are logged at too high a level.
Some of you may have noticed we can log in different ways. For example, we can log message strings:
logger.debug "Logging order total " + orderTotal + " can be an expensive operation"
We can also log in a block:
logger.debug {"Logging order total " + orderTotal + " can be an expensive operation"}
The two statements seem fairly similar. However, since in the second example we’re technically logging a block of code (indicated by the curly braces), the string concatenation and any other processing required for the log message aren’t completed unless the log level is set to debug. In contrast, in the first example the application concatenates the string before inspecting whether the log level applies.

By default, we typically log into environment-specific log files in our Rails app. However, logging into a server in order to grep or tail a file lacks any real-world usability. We need a way to mine our logs for information as well as stay on top of issues and metrics.
Since searching files isn’t sustainable, what is? First, let’s consider a tool like Retrace.
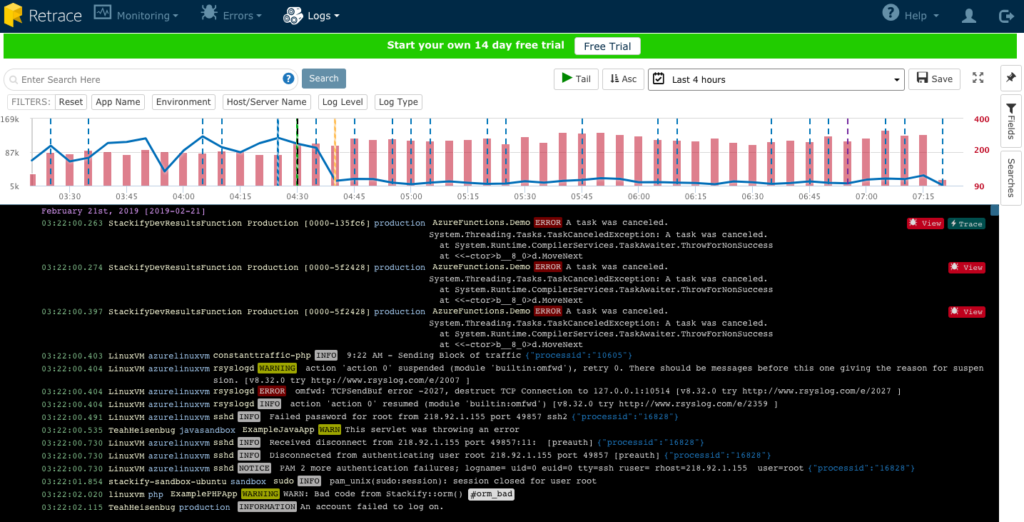
With Retrace, you can consolidate and view logs easily. You can also easily search and filter for logs. And, most interestingly, you can analyze trends in the logs. Installing and configuring Retrace for your Rails app involves just a few steps.
Another great feature of the Rails logger involves tags. Tags help categorize different logs for different use cases.
You can tag user-generated request UUIDs, particular logging use cases, or relevant categories based on the code that executes. For example, let’s consider tagging logs with a request ID. Why would we want to do this? Well, it will provide an easy way to see all the log messages related to a particular request. This helps tremendously when debugging an issue. You’re able to see everything that happened to that request with some simple configuration.
So let’s add our request ID to our log tags.
config.log_tags = [:request_id]
Now our log messages will include the request ID in every log message that’s part of the requesting thread.
Once you start using tags, you’ll find more and more creative uses that provide value.
Next, let’s consider the user of the logs, who might be you; r it might be someone on your team, in operations, or in customer support. And these users may be in different time zones, have different knowledge of the application, or have different skill levels. Additionally, the logs may serve different use cases. Logs meant for metric gathering may need a completely different message format than logs meant for debugging server failures.
So whenever we log messages, we should consider a few questions:
These questions can be general and apply to most applications. They can also be product-specific. Different business use cases may require different information logged at different granularities. You’ll have to determine for yourself what the answers are. For now, let’s look at a generic example.
Let’s say we want to log client requests to our application. And let’s also say we have two use cases for this:
Sometimes you can satisfy both in one log message. However, other times you may want separate log messages for each use case. And then you can use tagging to differentiate the purpose of the log.
Let’s look at these two use cases separately.
When considering our three questions, the first one is now answered. We want logs that help troubleshoot issues with requests. For the second question, we want to consider who reads the log message. In most cases, this will be a developer or support person with either surface-level or in-depth knowledge of the application.
Now let’s answer the third question. What data provides the relevant metrics? Here’s a list I would want to see as a developer or support person:
Are there others that might be helpful? As you can see, there’s a lot of info that can provide insight into our requests.
For our second example, we want to log for metrics gathering. Typically, the target of this data will be a dashboard or alerting system. The dashboard will show trends in data, while an alerting system will trigger pages or notifications based on changes in those trends.
For instance, let’s say one of our endpoints has successful responses 98% of the time. But at some point, that percentage drops to 80% or even lower. We may want to page our team to investigate the downward trend. And our team would want to look at the logs in our first example above.
But what would our dashboards and alerts need?
We don’t need as much information in this log because no one will be using it to diagnose the issue. It’s only there to keep track of outcomes.
As you can see, log messages might need specialization for particular use cases. Sometimes the same log message will provide data for both, but other times we’ll have to design the right solution for the job.

Now that we’ve gone over the basics of Rails logging as well as some best practices, let’s consider some parting words.
Often, not much thought is put into logging. In fact, we usually only notice how bad logs are when we need good logging the most, like during a production incident or when debugging a sneaky bug. But if we put some thought into our logging strategies beforehand, we can cover most of our bases. Will we need to modify our format or change what we’re logging as we learn more? Yes, of course. But that doesn’t mean we should wait until that nasty problem in production surfaces before we do something about our logs.
Don’t underestimate the power of logs. Learn to use them to their full potential.
Stackify's APM tools are used by thousands of .NET, Java, PHP, Node.js, Python, & Ruby developers all over the world.
Explore Retrace's product features to learn more.


