Monitoring and reporting on your most important business metrics is a fundamental part of any APM or ITIM solution. Our Retrace Power User Tips and Tricks series has already looked at “Error and Log Management” functionalities. We’ve discussed useful, advanced features for monitoring app performance in our “Extending APM” post. In this latest edition, let’s take a look at how power users capture advanced server and application metrics. Such metrics don’t always come configured out of the box. Then we’ll look at the best ways to report and visualize these metrics through Custom Dashboards.
Developing in ASP.NET includes the highly beneficial capability of hooking into Microsoft’s development platform through Performance Counters. Retrace already supports adding Performance Counters as metrics to monitor to your App Dashboard!
For your apps developed in .NET and/or being hosted in IIS, you can beef up Retrace monitoring capabilities by adding a number of different categories as metrics. These additional metrics can range from server level health metrics (like process level CPU/memory%) to things like Web Traffic counters (such as “Requests in queue” or “Current Connections”) and even .NET CLR exceptions.
The value of adding these important metrics in Retrace is that you can set up appropriate threshold ranges and apply Warning, Critical or Outage alerts, just like with any other monitor you configure within the Retrace platform. Our Engineering and SRE teams continually improve the process of establishing baselines for the monitors. With properly tuning thresholds against those baselines, you’ll easily configure alerts associated only with true performance problems.
Avoiding alert fatigue is a priority for every IT department, and that starts by properly identifying true performance problems. By giving users the flexibility to use any Performance Counters as a monitoring category, Retrace leverages a consistent interface for collecting key system metrics that impact performance.
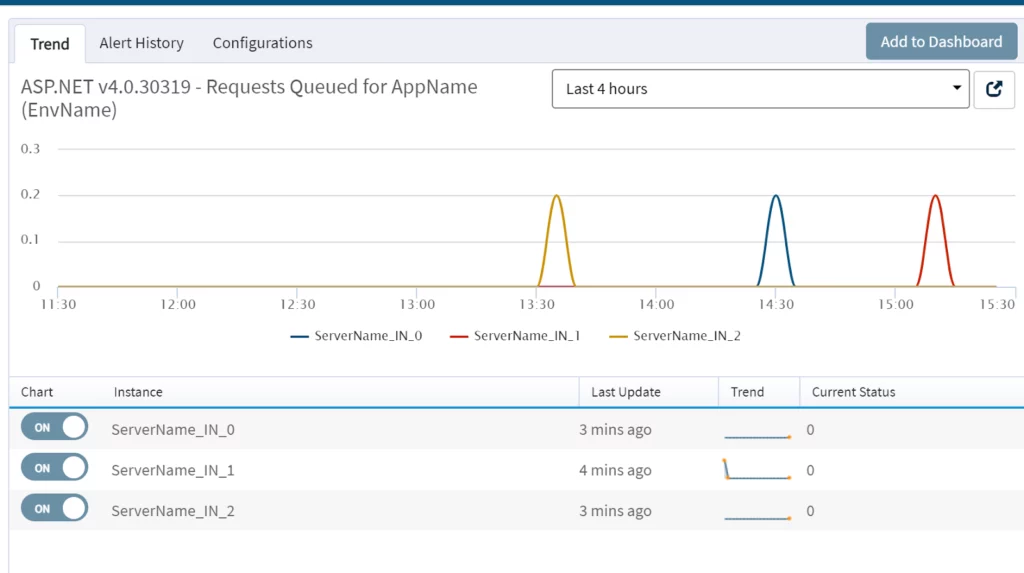
For a real world example, when we wanted to see how many requests were waiting in the queue on each server (a counter that can indicate that the server can’t handle requests fast enough), we configured a “Requests Queued” metric under the “ASP.NET” category. Monitoring this over time helps establish baselines. Then adding thresholds catches any spikes that may occur later, which improves troubleshooting and reduces alert noise.
Be sure to check out Top ASP.NET Counters and How to Monitor Them for a deeper dive into which counters can be especially useful.
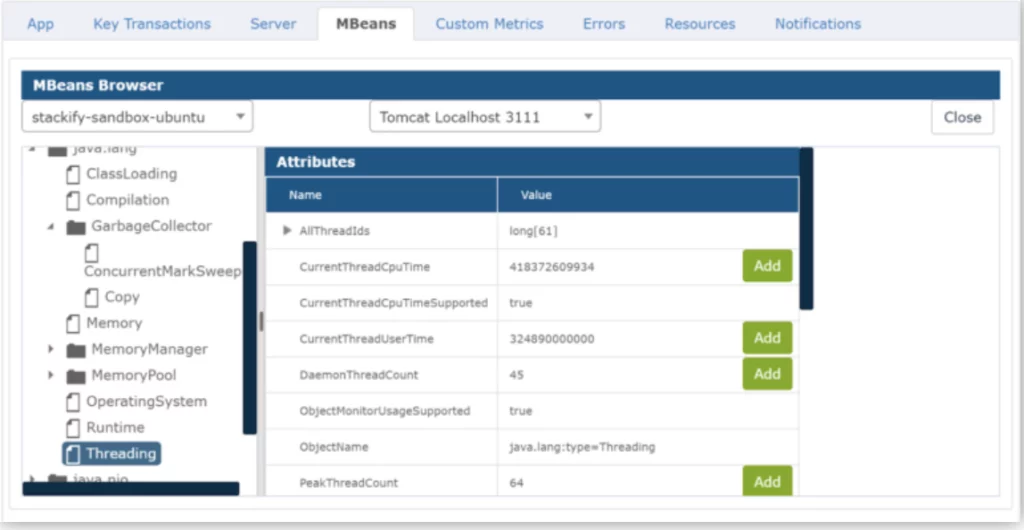
Similar to Performance Counters for .NET, Advanced metrics can be configured in Java through Managed Beans, or mBeans. These mBeans are basically wrappers for services, components, or resources that get registered through the Java Management Extensions (JMX) technology. Retrace supports adding JMX connections to your monitoring metrics. This enables you to browse, monitor and track all of your mBeans for applications you monitor with Retrace.
The value of adding mBean to your Retrace monitoring is basically doing for Java what Performance Counters does for .NET. Power users know, the more definition you give to your baselines, the better Retrace is equipped to reduce alert fatigue. And with the right thresholds, Retrace will alert you only when true performance problems arise.
The biggest challenge, even for power users, is knowing which mBeans to add for improved monitoring. Be sure to reference “How to Monitor Java Services” and “Guide to Tomcat Performance Monitoring” for some helpful tips.
No matter what you are monitoring, the same principles apply:
With properly tuned alerts, Retrace enables you to capture actionable insights for all of your mission-critical applications.
We just covered the power that using advanced metrics can bring when it comes to monitoring. Another important part is having proper visibility, and Custom Dashboards are a great way to achieve that. Custom Dashboards provide the flexibility you need to simplify the creation of different dashboards or widgets for different teams or roles.
The Retrace Application Metrics Widget is powerful and flexible, enabling you to add any app metric to any dashboard. This means we could add any aforementioned Performance Counter or mBean monitored by Retrace to any dashboard. Here’s how you do it:
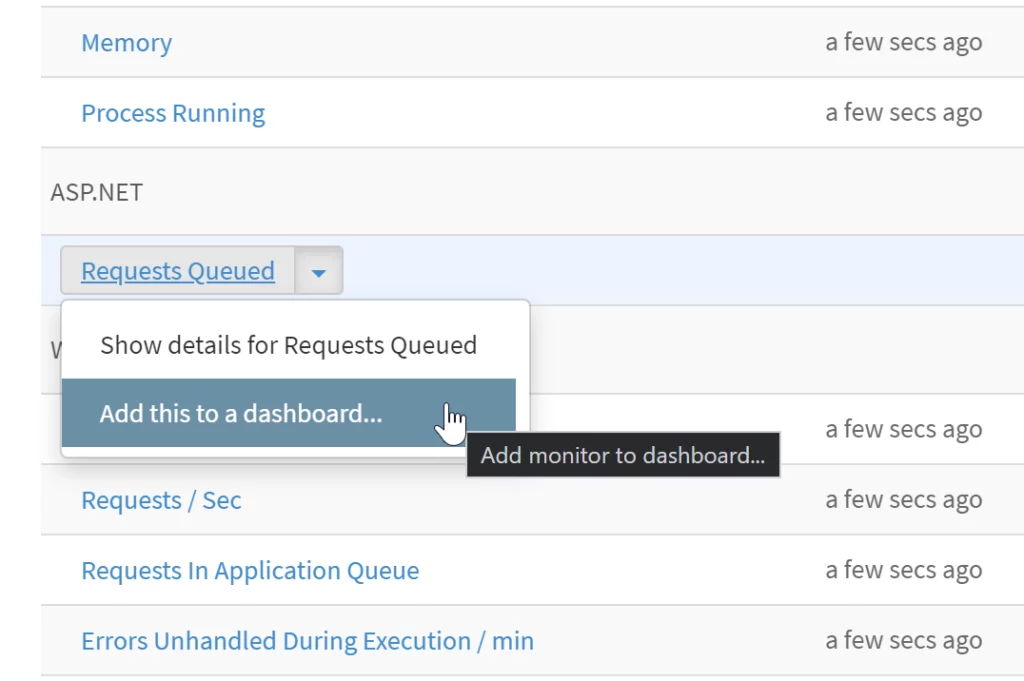
First, select the dropdown next to the metric you intend to add and select “Add this to a dashboard.” Next, a configuration modal will pop up where the selected metric can be filtered down further by App, Server and/or Environment to ensure that the proper scope is reporting on the dashboard.
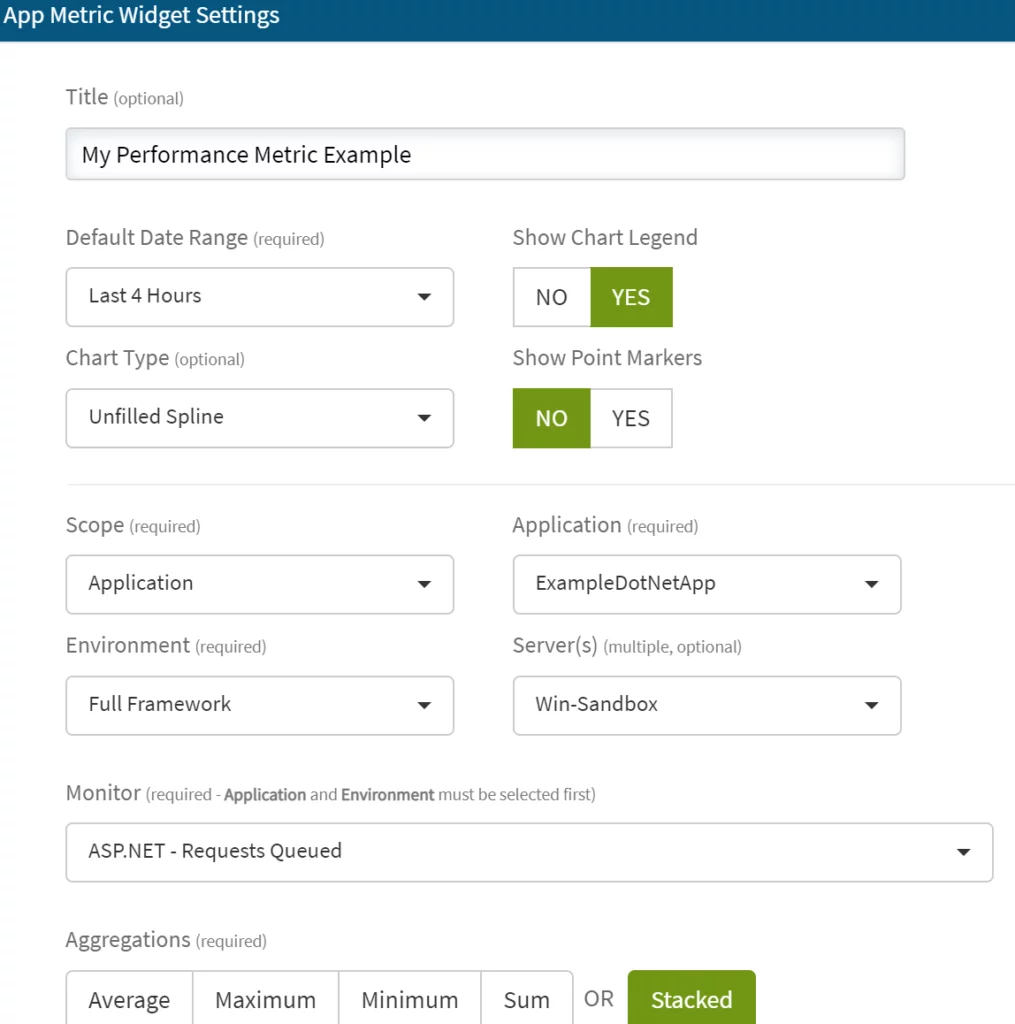
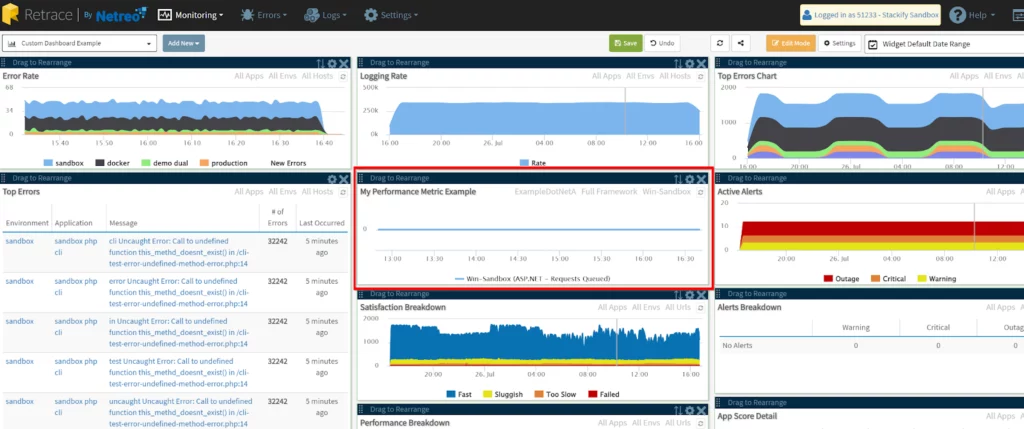
Finally, once you configure and click “Add to Dashboard,” the metric will show up as its own widget alongside any other widgets configured for that dashboard.
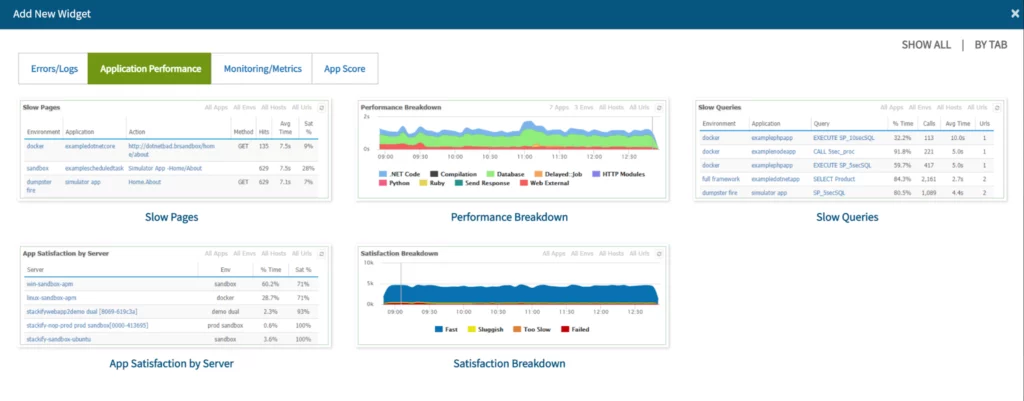
In addition to adding metrics to the dashboard, you can configure a number of other widgets related to categories like Errors and Logs, Application Performance, Monitoring and Metrics and App Scores.
To see all the other benefits and abilities of Custom Dashboards, be sure to check out the Custom Dashboard documentation.
Stackify's APM tools are used by thousands of .NET, Java, PHP, Node.js, Python, & Ruby developers all over the world.
Explore Retrace's product features to learn more.


