Application server monitoring metrics and runtime characteristics are essential for the applications running on each server. Additionally, monitoring prevents or resolves potential issues in a timely manner. As far as Java applications go, Apache Tomcat is one of the most commonly used servers. Tomcat performance monitoring can be done with JMX beans or a monitoring tool such as MoSKito or JavaMelody.
It’s important to know what is relevant to monitor and the acceptable values for the metrics being watched. In this article, you will take a look at:
When checking application performance, there are several areas that provide clues on whether everything is working within ideal parameters. Here are some of the key areas you’ll want to monitor:
This reading is critical because running low on heap memory will cause your application to perform slower. It can even lead to OutOfMemory exceptions. In addition, using as little available memory as possible could decrease your memory needs and minimize costs.
You have to determine the right frequency for running garbage collection, since this is a resource-intensive process. Additionally, you need to see if a sufficient amount of memory has been freed up.
Too many active threads at the same time can slow down the application or the whole server.
Request Throughput measures the number of requests the server can handle for a certain unit of time and helps determine your hardware needs.
A similar measure to the request throughput, this metric identifies the number of sessions the server can support at a given time.
Users are likely to quit if your system takes too long to respond to requests, therefore it is crucial to monitor the response time and investigate the potential causes of response delays.
Monitoring the data connection pool can help determine the number of connections in a pool that your application needs.
This metric helps identify codebase issues.
The uptime metric shows how long your server has been running or down.
Tomcat servers help you monitor performance by providing JMX beans for most of these metrics, which can be verified using a tool like Tomcat Manager or JavaMelody.
Next, we’re going to look at each area of Tomcat performance, any MBeans definitions that can help you monitor performance, and the means by which you can view metric values.
But first, let’s start with investigating a very simple application that we are going to use as an example to monitor.
For this example, we’re gonna use a small web service application that uses an H2 database built with Maven and Jersey.
The application will manipulate a simple User entity:
public class User {
    private String email;
    private String name;

    // standard constructors, getters, setters
}
The REST web service defined has two endpoints that saves a new User to the database and outputs the list of Users in JSON format:
@Path("/users")
public class UserService {
    private UserDAO userDao = new UserDAO();

    public UserService () {
        userDao.createTable();
    }

    @POST
    @Consumes(MediaType.APPLICATION_JSON)
    public Response addUser(User user) {
        userDao.add(user);
        return Response.ok()
            .build();
    }

    @GET
    @Produces(MediaType.APPLICATION_JSON)
    public List<User> getUsers() {
        return userDao.findAll();
    }
}
Building a REST web service is outside the scope of this piece. For more information, check out our article on Java Web Services.
Also, note that the examples in this article are tested with Tomcat version 9.0.0.M26. For other versions, the names of beans or attributes may differ slightly.
One way of obtaining the values of the MBeans is through the Manager App that comes with Tomcat. This app is protected, so to access it, you need to first define a user and password by adding the following in the conf/tomcat-users.xml file:
<role rolename="manager-gui"/>
<role rolename="manager-jmx"/>
<user username="tomcat" password="s3cret" roles="manager-gui, manager-jmx"/>
The Manager App interface can be accessed at http://localhost:8080/manager/html and contains some minimal information on the server status and the deployed applications. Manager App also provides the capability of deploying a new application.
For the purpose of performance monitoring, one interesting feature of the Manager App is the ability to check for memory leaks.
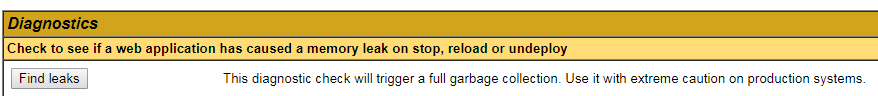
The “Find Leaks” feature will look for memory leaks in all the deployed applications.
Information on the JMX beans can be found at http://localhost:8080/manager/jmxproxy. The information is in text format, as it is intended for tool processing.
To retrieve data about a specific bean, you can add parameters to the URL that represent the name of the bean and attribute you want:
http://localhost:8080/manager/jmxproxy/?get=java.lang:type=Memory&att=HeapMemoryUsage
Overall, this tool can be useful for a quick check, but it’s limited and unreliable, so not recommended for production instances.
Next, let’s move on to a tool that provides a friendlier user interface.
If you’re using Maven, simply add the javamelody-core dependency to the pom.xml:
<dependency>
    <groupId>net.bull.javamelody</groupId>
    <artifactId>javamelody-core</artifactId>
    <version>1.69.0</version>
</dependency>
In this way, you can enable monitoring of your web application.
After deploying the application on Tomcat, you can access the monitoring screens at the /monitoring URL.
JavaMelody contains useful graphs for displaying information related to various performance measures, as well as a way to find the values of the Tomcat JMX beans.
Most of these beans are JVM-specific and not application-specific.
Let’s go through each of the most important metrics, see what MBeans are available and how to monitor them in other ways.
Monitoring used and available memory is helpful for both ensuring proper functioning of the server and obtaining statistics. When the system can no longer create new objects due to a lack of memory, the JVM will throw an exception.
Note that a constant increase in memory usage without a corresponding rise in activity level is indicative of a memory leak.
Generally, it’s difficult to set a minimum absolute value for the available memory. You should instead base it on observing the trends of a particular application. Of course, the maximum value should not exceed the size of the available physical RAM.
The minimum and maximum heap size can be set in Tomcat by adding the parameters:
set CATALINA_OPTS=%CATALINA_OPTS% -Xms1024m -Xmx1024m
Oracle recommends setting the same value for the two arguments to minimize garbage collections.
To view the available memory, you can inspect the MBean java.lang:type=Memory with the attribute HeapMemoryUsage:

The MBeans page is accessible at the /monitoring?part=mbeans URL.
Also, the MBean java.lang:type=MemoryPool has attributes that show the memory usage for every type of heap memory.
Since this bean only shows the current status of the memory, you can check the “Used memory” graph of JavaMelody to see the evolution of memory usage over a period of time.

In the graph, you can see the highest memory-use reading was 292 MB, while the average is 202 MB of the allocated 1024 MB, which means more than enough memory is available for this process.
Note that JavaMelody runs on the same Tomcat server, which does have a small impact on the readings.
Garbage collection is the process through which unused objects are released to free up memory. If the system spends more than 98% of CPU time doing garbage collection and recovers less than 2% heap, the JVM will throw an OutOfMemoryError with the message “GC overhead limit exceeded.”
Such an error message usually indicates a memory leak, so it’s a good idea to watch for values approaching these limits and investigate the code.
To check these values, look at the java.lang:type=GarbageCollector MBean, particularly the LastGcInfo attribute, which shows information about the memory status, duration and thread count of the last execution of the GC.
A full garbage collection cycle can be triggered from JavaMelody using the “Execute the garbage collection” link.Let’s look at the evolution of the memory usage before and after garbage collection:

In the case of the example application, the GC is run at 23:30 and the graph shows that a large percentage of memory is reclaimed.
To find the status of the in-use threads, Tomcat provides the ThreadPool MBean. The attributes currentThreadsBusy, currentThreadCount and maxThreads provide information on the number of threads currently busy, currently in the thread pool and the maximum number of threads that can be created.
By default, Tomcat uses a maxThreads number of 200.
If you expect a larger number of concurrent requests, you can increase the count naturally by modifying the conf/server.xml file:
<Connector port="8080" protocol="HTTP/1.1"
  connectionTimeout="20000"
  redirectPort="8443"
  maxThreads="400"/>
Alternatively, if the system performs poorly with a high thread count, you can adjust the value. What’s important here is a good battery of performance tests to put load on the system to see how the application and the server handle that load.
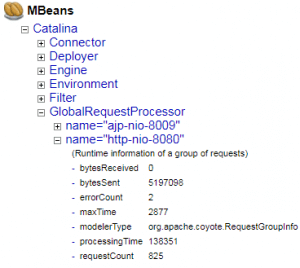
For determining the number of requests in a given period, you can use the MBean Catalina:type=GlobalRequestProcessor, which has attributes like requestCount and errorCount that represent the total number of requests performed and errors encountered.
The maxTime attribute shows the longest time to process a request, while processingTime represents the total time for processing all requests.
The disadvantage of viewing this MBean directly is that it includes all the requests made to the server. To isolate the HTTP requests, you can check out the “HTTP hits per minute” graph of the JavaMelody interface.
Let’s send a request that retrieves the list of users, then a set of requests to add a user and display the list again:
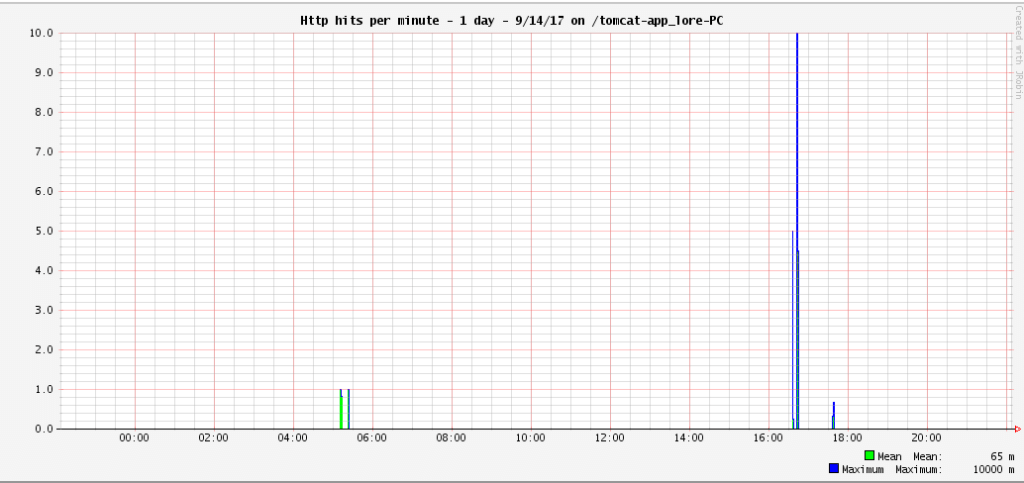
You can see the number of requests sent around 17:00 displayed in the chart with an average execution time of 65 ms.
JavaMelody provides high-level information on all the requests and the average response time. However, if you want more detailed knowledge on each request, you can add another tool like Prefix for monitoring the performance of the application per individual web request.
Another advantage of Prefix is locating which requests belong to which application, in case you have multiple applications deployed on the same Tomcat server.
In order to use both JavaMelody and Prefix, you have to disable the gzip compression of the JavaMelody monitoring reports to avoid encoding everything twice.
To disable the gzip compression, simply add the gzip-compression-disabled parameter to the MonitoringFilter class in the web.xml of the application:
<filter>
  <filter-name>javamelody</filter-name>
  <filter-class>net.bull.javamelody.MonitoringFilter</filter-class>
  <init-param>
    <param-name>gzip-compression-disabled</param-name>
    <param-value>true</param-value>
  </init-param>
</filter>
Next, download Prefix, then create a setenv.bat (setenv.sh for Unix systems) file in the bin directory of the Tomcat installation. In this file, add the -javaagent parameter to CATALINA_OPTS to enable Prefix profiling for the Tomcat server.
set CATALINA_OPTS=%CATALINA_OPTS% -javaagent:"C:\Program Files (x86)\StackifyPrefix\java\lib\stackify-java-apm.jar"
Now you can access the Prefix reports at http://localhost:2012/, view the time at which each request was executed and how long it took:
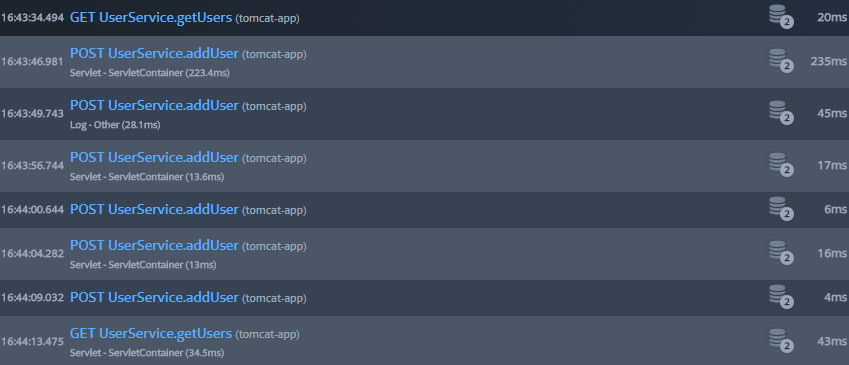
This is very useful for tracking down the cause of any lag in your application.
Connecting to a database is an intensive process, which is why it’s important to use a connection pool.
Tomcat provides a way to configure a JNDI data source that uses connection pooling by adding a Resource element in the conf/context.xml file:
<Resource
  name="jdbc/MyDataSource"
  auth="Container"
  type="javax.sql.DataSource"
  maxActive="100"
  maxIdle="30"
  maxWait="10000"
  driverClassName="org.h2.Driver"
  url="jdbc:h2:mem:myDb;DB_CLOSE_DELAY=-1"
  username="sa"
  password="sa"
/>
The MBean Catalina:type=DataSource can then display information regarding the JNDI data source, such as numActive and numIdle, representing the number of active or idle connections.
For the database connections to be displayed in the JavaMelody interface, you need to name the JNDI data source MyDataSource. Afterwards, you can consult graphs such as “SQL hits per minute,” “SQL mean times,” and “% of sql errors.”
For more detail on each SQL command sent to the database, you can consult Prefix for each HTTP request. A database icon marks requests that involve a database connection.
Prefix will display the SQL query that was generated by the application. Let’s see the data recorded by Prefix for a call to the addUser() endpoint method:

The screenshot above shows the SQL code, as well as the result of the execution.
In case there is an SQL error, Prefix will show you this as well. For example, if someone attempts to add a user with an existing email address, this causes a primary key constraint violation:

The tool shows the SQL error message, as well as the script that caused it.
[adinserter block=”33″]
Errors are a sign that your application is not performing as expected, so it’s important to monitor the rate at which they occur. Tomcat does not provide an MBean for this, but you can use other tools to find this information.
Let’s introduce an error in the example application by writing an incorrect name for the JNDI data source and see how the performance tools behave.
JavaMelody provides a “%of HTTP errors” chart which shows what percentage of requests at a given time resulted in an error:

The chart shows you that an error occurred, but it’s not very helpful in identifying the error. To do this, you can turn to Prefix, which highlights HTTP requests that ended with an error code:

If you select this request, Prefix will display details regarding the endpoint that was accessed and the error encountered:

Using Prefix we see that the error happened when accessing the /users endpoint, and the cause is “MyyyDataSource is not bound in this context,” meaning the JNDI data source with the incorrect name was not found.
Tomcat performance monitoring is crucial in running your Java applications in production successfully. Tomcat memory monitoring ensures that your application responds to requests without significant delays and identifies any potential errors or memory leaks in your code. You need this data to keep track of production applications and proactively monitor any issues that may come up.
Tomcat anticipates this need by providing a series of performance-related JMX beans you can monitor. In addition, a production-grade APM tool such as Prefix can make the task a lot easier, as well as scalable.
Prefix is a developer’s trusted sidekick that helps them write better code through web request tracing and other functions. Prefix works with .NET, Java, PHP, Node.js, Ruby, and Python.
See Prefix in action. Download for FREE today!
Stackify's APM tools are used by thousands of .NET, Java, PHP, Node.js, Python, & Ruby developers all over the world.
Explore Retrace's product features to learn more.


