How to Monitor Java Services – Performance, Errors, and more
By: mwatson
| October 13, 2017

In the real world, a lot of mission-critical business logic lives in background services. Buying something from an e-commerce website, like Amazon, kicks off a wide array of tasks that must be completed after you click to confirm your order. Monitoring the performance of your web applications is only part of the puzzle if you want to proactively ensure your software is working correctly at all times.
If you want to ensure that your software is working correctly, you need to monitor your Java services that are handling these mission-critical background tasks.
In this guide, we are going to walk through how to monitor your Java services.
Why Monitoring a Java Service is Different
Monitoring Java Services is different than monitoring Java web applications. Web applications have very defined “transactions” based on each web request executing within your application container. It is very simple for services like Retrace to identify each individual web request and track the performance of them.
Java services have no defined start or end to the work that they do. They typically start and run continuously until the server is turned off. To properly monitor the performance of your Java Services, you need to define the start and end of the transactions or “operations” they are performing.
Identifying “Operations” in Your Java Services
Java services usually follow several common usage patterns. By identifying these patterns, you can quickly evaluate the best way to identify operations in your code.
Think of an operation as a small unit of work that is repeated over and over. You need to identify which of them you want to monitor within your code.
Common usage patterns:
- Queue listener – App continuously listens on a queue and each message picked up off a queue would be a unique operation.
- Timer based – Many Java services use timers to repeat a specific operation every few seconds like polling a database.
- Job scheduler – It is possible to embed a job scheduler like Quartz within your Java service to trigger small jobs and scale them across servers.
Most Java services are likely to perform multiple operations. I would suggest breaking them down to the smallest logical units of work. It is better if you monitor more smaller units of work. This is similar to monitoring each web request in your web application versus monitoring the performance of the web application as a whole.
For example, our monitoring agent for Linux is a Java service. It does a ton of different operations on a schedule every few seconds. Each one of those tasks that it performs should be defined as unique operations so you can track everything that it does.
How to Instrument “Operations” in Your Code for Retrace
Once you have identified the operations you would like to track, you will need to make a few minor code annotations to define your operations. This is done by adding the Stackify Java APM annotations dependency to your project’s pom.xml file.
<dependency>
   <groupId>com.stackify</groupId>
   <artifactId>stackify-java-apm-annot</artifactId>
   <version>1.0.4</version>
</dependency>
Example of instrumenting your code for Retrace:
import com.stackify.apm.Trace;

@Trace
public class ClassToBeInstrumented
{
	@Trace(start = true)
	public void methodToStartNewTrace()
	{
		...
	}
}
For more information and code examples, please see our docs and Github repo about using Retrace for tracking standalone Java applications.
How to Install Retrace for Java Services
Retrace utilizes lightweight Java profiling and other data collection techniques. It is installed a service on your Linux server and runs in the background. Our agent is easily installed via a curl or wget command. Please see our docs for full directions.
Retrace provides developers many benefits for Java service performance monitoring. Retrace provides holistic Java service performance monitoring including code profiling, errors, logs, metrics, and more.
Benefits of Monitoring Java Services with Retrace
Once your code has been instrumented and Retrace is collecting data about your Java service, you can get some amazing details about what your code is doing. Retrace can monitor standalone Java applications running via various service managers.
Retrace automatically supports most common Java dependencies and frameworks with no code changes. You can instantly see how they are being used by your application and how they impact performance. This includes PostgreSQL, MySql, Oracle, external web services, MongoDB, Elasticsearch, Redis, Quartz, Hibernate and much more.
Identifying Top Operations
Retrace allows you to see all the operations being executed within your Java service. Quickly identify how often each of them are executed, average run time, and much more. The performance of Java services is typically a “black box”. Retrace enables you to understand exactly what your Java service is doing.

Tracking Top SQL Queries
Retrace automatically tracks every SQL query executed by your code. This includes stored procedures, dynamic SQL, crazy looking Hibernate queries and more. Quickly identify which queries are being executed, how long they take, and how often they are being called.

View Application Exceptions & Logs
Since Retrace works via lightweight Java code profiling, it also has the ability to collect unhandled exceptions being thrown by your code. It can also track exceptions being logged to your logging framework.
Retrace provides powerful error monitoring and log management features. You can send all of your logging to Retrace via log4j, logback, and others. With Retrace you can search across all of your logs from one place and do many other advanced log management features.
Tracking Custom Application Metrics
Retrace automatically tracks the CPU and memory usage of your Java service. You can also use it to track many other standard JMX MBeans. Including stats around garbage collection and exceptions be thrown per second. Retrace can also monitor custom JMX mBeans created by your applications.
Custom metrics are also supported by using Stackify’s maven package “stackify-metrics”. With just a couple lines of code you can track how often or long it takes your Java service to do virtually anything.
Learn More: When & How to Use Custom Application Metrics
View Code Level Traces
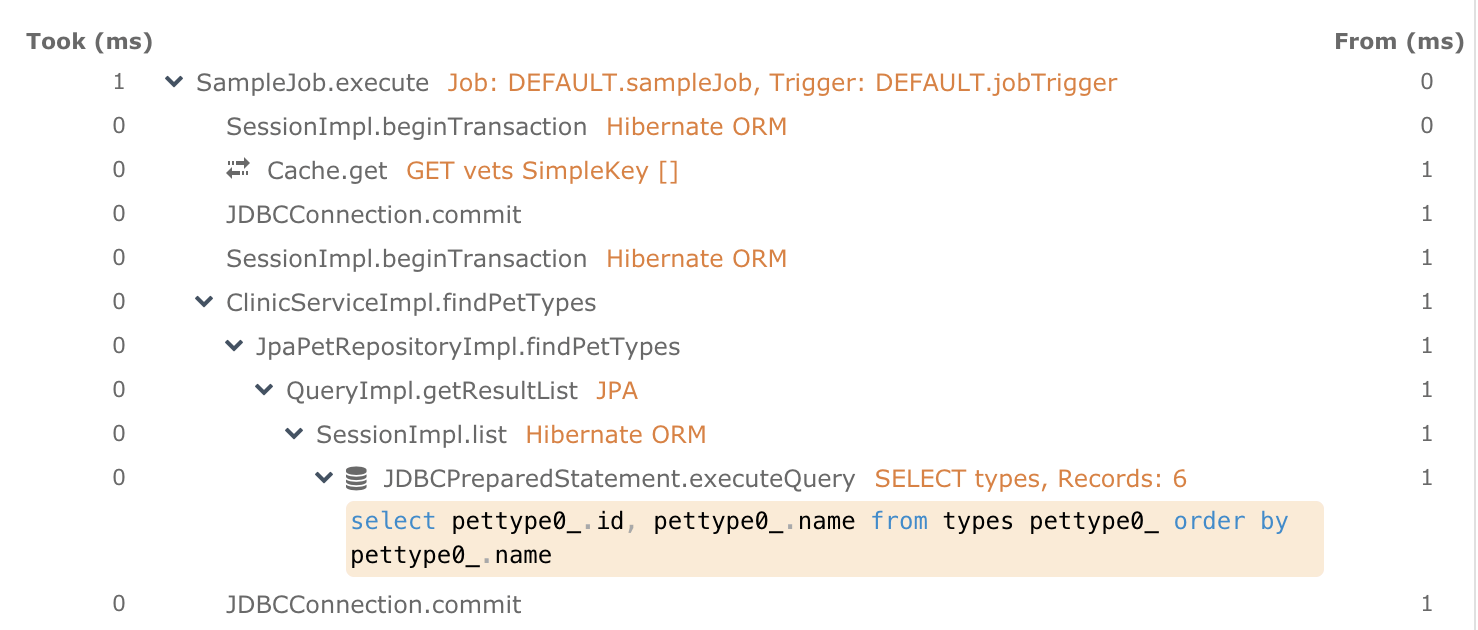
One of the most powerful features of Retrace is the code level snapshots that it collects. For any of the operations being tracked for your Java Service, you can view all of the key methods, dependencies being called, exceptions, logs, and much more in context.
Example trace from a Java Service running Quartz:

Summary
Developers heavily depend on Java services to get a lot of mission critical work done. Monitoring Java services is critical to make sure that they are working correctly and performing well.
Retrace is an excellent solution for monitoring the performance of your Java services. To learn more, check out our product page about Retrace and our overview of application monitoring.
Improve Your Code with Retrace APM
Stackify's APM tools are used by thousands of .NET, Java, PHP, Node.js, Python, & Ruby developers all over the world.
Explore Retrace's product features to learn more.
Learn More


