If you are trying to figure out how to measure the performance of your application, you are in the correct place. We spend a lot of time at Stackify thinking about application performance, especially about how to monitor and improve it. In this article, we cover some of our most important application performance metrics you should be tracking.
Before we cover some of the most important application performance metrics you should be tracking, let’s speak briefly about what application performance metrics is.
Application Performance Metrics are the indicators used to measure and track the performance of software applications. Performance here includes and is not limited to availability, end-user experience, resource utilization, reliability, and responsiveness of your software application.
The act of continuously monitoring your application’s metrics is called Application Performance Monitoring.
But why is this important?
For starters, application performance metrics allow you and your team to address issues affecting your application proactively. This is particularly important in situations when the application is the business itself.
Monitoring application performance metrics allows helps your team:
However, as important as it is to monitor application performance metrics, trying to monitor everything will be a time-consuming, ineffective, and unproductive use of resources. Thus, tracking the right metrics is much more important as this will provide better insights and understanding of the technical functionality of your application.
Here are some of the most important application performance metrics you should be tracking.
The application performance index, or Apdex score, has become an industry standard for tracking the relative performance of an application.
It works by specifying a goal for how long a specific web request or transaction should take.
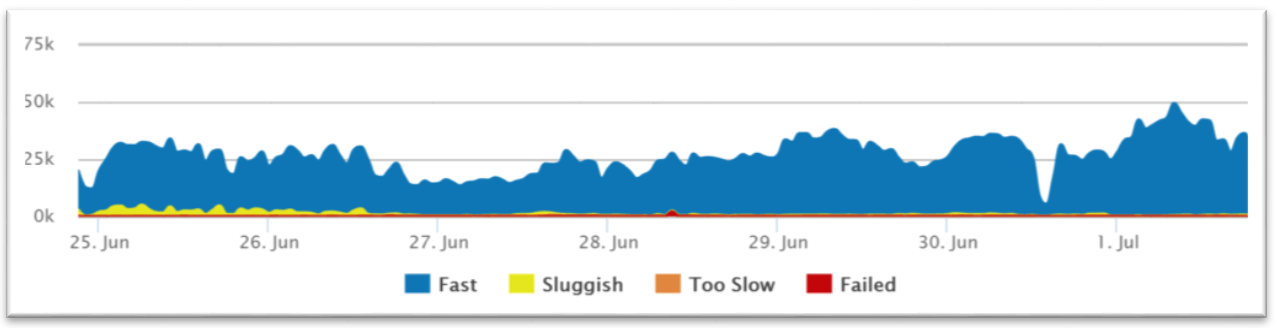
Those transactions are then bucketed into satisfied (fast), tolerating (sluggish), too slow, and failed requests. A simple math formula is then applied to provide a score from 0 to 1.

Retrace automatically tracks satisfaction scores for every one of your applications and web requests. We convert the number to a 0-100 instead of 0-1 representation to make it easier to understand.
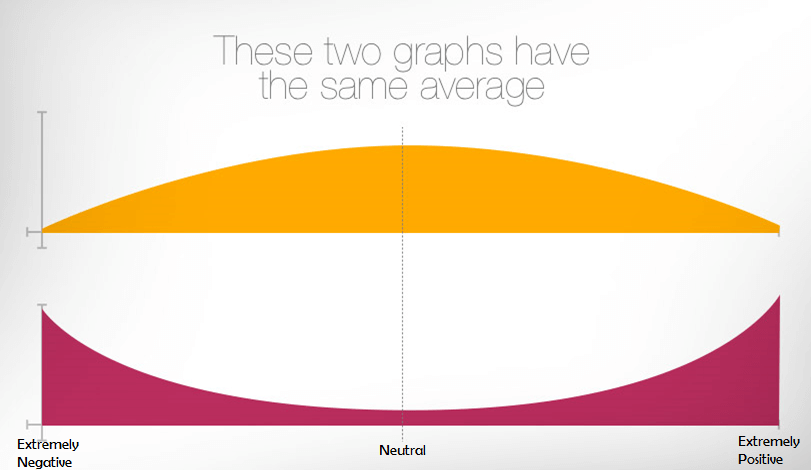
Let me start by saying that averages suck. I highly recommend using the aforementioned user satisfaction Apdex scores as a preferred way to track overall performance. That said, averages are still a useful application performance metric.
The last thing you want your users to see are errors. Monitoring error rates is a critical application performance metric.
There are potentially 3 different ways to track application errors:
It is common to see thousands of exceptions being thrown and ignored within an application. Hidden application exceptions can cause a lot of performance problems.
If your application scales up and down in the cloud, it is important to know how many server/application instances you have running. Auto-scaling can help ensure your application scales to meet demand and saves you money during off-peak times. This also creates some unique monitoring challenges.
For example, if your application automatically scales up based on CPU usage, you may never see your CPU get high. You would instead see the number of server instances get high. (Not to mention your hosting bill going way up!)

Understanding how much traffic your application receives will impact the success of your application. Potentially all other application performance metrics are affected by increases or decreases in traffic.
Request rates can be useful to correlate to other application performance metrics to understand the dynamics of how your application scales.
Monitoring the request rate can also be good to watch for spikes or even inactivity. If you have a busy API that suddenly gets no traffic at all, that could be a really bad thing to watch out for.
A similar but slightly different metric to track is the number of concurrent users. This is another interesting metric to track to see how it correlates.
If the CPU usage on your server is extremely high, you can guarantee you will have application performance problems. Monitoring the CPU usage of your server and applications is a basic and critical metric.
Virtually all server and application monitoring tools can track your CPU usage and provide monitoring alerts. It is important to track them per server but also as an aggregate across all the individually deployed instances of your application.
Monitoring and measuring if your application is online and available is a key metric you should be tracking. Most companies use this as a way to measure uptime for service level agreements (SLA).
If you have a web application, the easiest way to monitor application availability is via a simple scheduled HTTP check.
Retrace can run these types of HTTP “ping” checks every minute for you. It can monitor response times, status codes, and even look for specific content on the page.
If your application is written in .NET, C#, or other programming languages that use garbage collection, you are probably aware of the performance problems that can arise from it.
When garbage collection occurs, it can cause your process to suspend and can use a lot of CPU.
Garbage collection metrics may not be one of the first things you think about key application performance metrics. It can be a hidden performance problem that is always a good idea to keep an eye on.
For .NET, you can monitor this via the Performance Counter of “% GC Time”. Java has similar capabilities via JMX metrics. Retrace can monitor these via its application metrics capabilities.

Memory usage is vital because it helps one gauge how an application manages and consumes resources during execution. However, it’s important to recognize that memory usage has technical and financial implications.
From a technical standpoint, high memory usage, memory leaks, or insufficient memory significantly affect application performance and scalability. This will result in slower response time, increased latency, frequent crashes, and potential downtime. However, on a financial front, high memory usage might require additional infrastructure costs like hardware upgrades, cloud service expenses, or additional resources to accommodate your needs.
Thus, monitoring memory effectively is crucial to ensure optimal application performance while minimizing financial impacts.
Throughput measures the number of transactions or requests an application can process within a given timeframe. It indicates how well an application handles a high volume of workloads. Thus a high throughput generally shows better performance and scalability.
It is, however, important to know that various factors like memory, disk I/O, and network bandwidth influence throughput. Regardless, it is an interesting metric to track, especially since you can use it for benchmarking, identifying resource limitations, and ensuring optimal resource utilization. It is also a decision-maker as it is great for accessing and making performance comparisons of systems and applications on different loads.
Application performance measurement is necessary for all types of applications. Depending on your type of application, there could be many other monitoring needs.
Retrace can help you monitor a broad range of web application performance metrics. Retrace collects critical metrics about your applications, servers, code level performance, application errors, logs, and more. These can be used for measuring and monitoring the performance of your application.
Stackify's APM tools are used by thousands of .NET, Java, PHP, Node.js, Python, & Ruby developers all over the world.
Explore Retrace's product features to learn more.


