
The Windows server is typically installed on heavy-use servers that act as the backbone of various IT apps and services. If you’re an organization that employs a Windows Server, you need to stay on top of your Windows server performance monitoring. This post discusses what Windows Server performance monitoring is and why it is essential, as well as best practices. Let’s get started!
In this post, we’ll discuss:
Let’s get started!
The term “Windows Server Performance Monitoring” defines the range of processes involved in tracking key metrics. The main goal is to ensure excellent performance. Windows Server includes the essential built-in tools for troubleshooting and analysis that allows you to monitor four critical aspects of performance, including the server’s CPU, hard disks, memory, and the network interface card (NIC).
To put it another way, Window performance monitoring helps identify bottlenecks and verify whether the app meets its performance objectives. It usually performs by collecting metrics that characterize the app’s behavior under diverse workload conditions, such as performance tests, stress, or single-user operation.
Creating an effective server performance monitoring strategy and drawing a clear baseline is the firstway to define acceptable server behavior. Defining a baseline essentially involves what is standard for the corporate servers. Deviations from the normal patterns show signs of trouble down the line. Thus, if there are fluctuations in the defined normal conditions, network administrators can catch the changes and take the necessary actions.
The other benefit of establishing a clear baseline is that it provides early indicators that servers are pushing towards the maximum available capacity. Such information is particularly useful for managers to plan for upgrades and growth.
What’s more? The baseline should not be what typical performance looks like on its own. Instead, it should be an ideal performance. In reality, the Windows Server Performance monitor ensures that your entire system is optimized and working well before establishing a baseline.
It’s pivotal to ensure that Windows server performance monitoring is done consistently. If you’re only occasionally monitoring, you can miss issues or not see a performance problem until it’s already too late. The monitoring process must be set up to continually watch the key components and their metrics such as CPU, memory, hard disks, and the network interface card. It’s also important to collect metrics on timing and usage for pages and queues, whether you have any server component health issues, general user behavior, and server access information.
It may seem like business hours are the most important to monitor, but it’s also essential to define a baseline for off-peak times. Sometimes, processes are set to occur during nighttime hours. However, you might miss critical issues if you do not track server performance during operations.
Using tools to monitor performance for machines running Windows Servers is essential to spot and troubleshoot problems. Several different tools are available for monitoring server performance. Some help check core metrics without allowing capacity planning or historical trends, while others are more comprehensive and offer broader network and app monitoring alongside the server performance.
Retrace includes robust monitoring capabilities and high scalability. It combines APM, error tracking, log management, and app metrics to monitor everything about your application. It also notifies relevant users via email, SMS, and Slack alerts on multiple monitoring thresholds and notifications groups.
Besides, custom dashboards allow Retrace to provide both holistic and granular data regarding server health. The dashboard widgets collect data on disk space, network utilization, uptime, and CPU usage. It supports both Windows servers and Linux.

Make sure you set up a system for creating automatic alerts and reports. This way, relevant information can be provided in real-time while dealing with performance issues.
Alerts help to ensure that you don’t miss a potential issue. Reports help to build a collection of historical data that allows you to go back and see security issues or attempted intrusions you may have missed the first time.
Suppose you customize the reports that showcase only the recent performance monitoring data. In that case, you’ll also save time avoiding information that isn’t useful.
Always monitor metrics that are relevant to Windows Servers. By measuring performance statistics, it is easier to check when and where measurements have changed significantly. Therefore, you can more easily pinpoint issues and start troubleshooting.
For instance, APM tools like Retrace, enable monitoring Windows Server metrics alongside a range of other servers and application metrics.
Moreover, you can gain insights into crucial server performance measurements like response time, packet loss, memory & disk capacity, hardware failures, and more.
Let’s look at some of the do’s and don’ts you can keep in your mind to help you start.
Ensure enough capacity and detect overloaded servers to monitor server-side performance metrics. Moreover, don’t forget to track key performance metrics for emails and app servers, such as CPU, memory, processes, services, and network statistics.
Instead of setting up real-time notifications, it’s better to create a baseline and track evolution and trends over time.
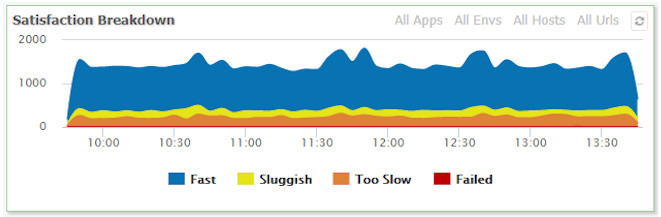
Make use of Retrace’s Apdex scores to convert measurements into real insights about user satisfaction along with easy to understand grade card scoring.
Downtime can be affected by providers or hardware and software failure. Thus, it’s important to keep monitoring.
It’s essential to include DNS services monitoring and other essential web app elements, including POP services and FTP, which impact the user experience.
Since they sometimes slow you down, don’t forget to manage them yourself to provide you with the best service.
Once you implement the above mentioned best practices, monitoring will be more comfortable, whether you’re monitoring a physical machine, an operating system, or web application. We hope this blog helps you make the most of your Windows server performance monitoring tool.
Stackify's APM tools are used by thousands of .NET, Java, PHP, Node.js, Python, & Ruby developers all over the world.
Explore Retrace's product features to learn more.


