Imagine a man, a metaphorical man, slumped over, sitting silently across from you. Do you see him? Hastily smashing his fingers against the keyboard with a feverish sweat running down his neck.
He, like many, only opens his APM solution after those universally feared “oh shit!” moments. Like a firefighter with a magnifying glass, he dives into his logs looking for a needle in a haystack. But you…
Well, you know better than that.
You wouldn’t just use your APM on bad days. You know the value of routine monitoring and analysis. After all, you are an all-knowing data ninja, too quick, too sharp, too wise, to get caught in a surprise dumpster fire, right?
Right!? Good.
But not good enough! You need more. You need control.
You crave it.
Personalization, customization, modularity, variables, you need it all. We hear you. You got it.
Retrace Custom Dashboards are out of beta, like a post-pubescent high school freshman reeking of cheap department store cologne and ready to take on the world, or at-least first period. But! Before you ask us to homecoming, here are 5 widgets you should add to your custom dashboards.
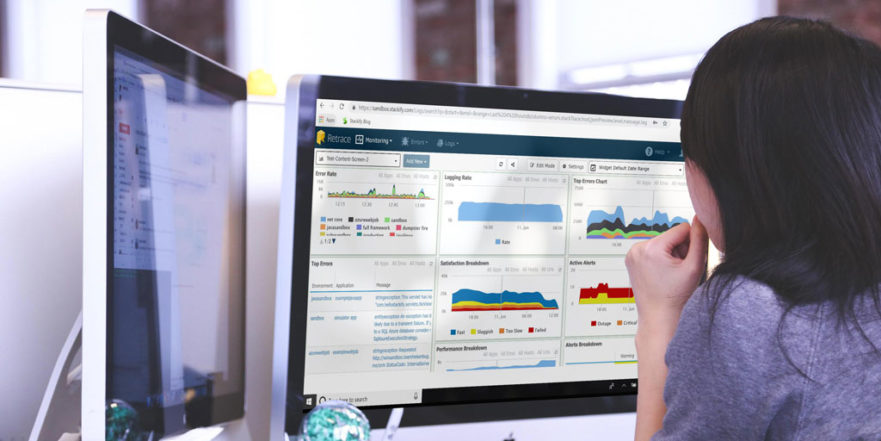
Start here, hovering over your application like some sort of digital helicopter pilot or high flying bird (we didn’t have the time or resources to figure out what type bird that would be, so you’ll have to give us a hand here and use your imagination, okay?).
Take a good hard look at performance broken down by activity within your code, which also includes SQL queries performed in the request. See what database queries, caching, queuing, or other parts of your stack are slowing your app down. Filter and modify like there’s no tomorrow. Filter by environment, server, application, and/or URL. Magnify specific periods of time with the click and drag feature.
Use these tools to identify trends and you’ll always be one step ahead.
Like a grade card for your app, just without the parent-teacher conferences and honor rolls. Retrace App Score Detail grades your app harder than your scary fifth-grade math teacher.
Retrace Scoring is represented using color-coded color grades calculated for every application and environment combination. This is helpful when attempting to compare applications from one environment to the next. Scores are generated every hour and take into account satisfaction, performance, error, and server metrics for the previous 7 days (168 hours).
App scoring helps you know when to tune CPU usage, keep an eye on errors/requests, and monitor application satisfaction. Pinpoint specific problem areas in need of a deeper dive, or use grading as an easy way to showcase your application across departments. Here’s a brief breakdown of each scoring category.
See just how much your app is pushing a server’s CPU. Use this score to identify where there might be inefficient code or incorrect scaling.
Take a look into the most recent new and regressed errors in an App. This can help teams identify and solve issues earlier in development and integration testing.
This score is based on the percentage of requests that return errors. Use this as a baseline to know when an application has an unusual amount of failures and exceptions.
This is an easy way to track the satisfaction of user-generated requests. To get a more in-depth report on user satisfaction, add the Satisfaction Breakdown widget to see a time-specific breakdown of a specific application, server, or URL/Action. To improve this score, you need to get your pages to load faster and reduce page failures.
Retrace uses our own secret formula to generate the scoring. Namely Apdex (Satisfaction), Error Metrics, and Server Metrics. We use weighting algorithms that remain consistent across applications and customers. You can read more about our App Scoring in our technical documentation library.
You know what they say: “Slow and steady wins the race. Unless you’re talking about page load times because those need to be very fast.” I think that’s how the saying goes.
Anyway, the Slow Pages widget gives quick insight into the worst offenders, the methods, hits, average load time, and satisfaction percentage. If the Slow Pages report helps you understand what is slow, then the Slow Queries report helps you understand why. See how many calls your app is making, identify the slow queries, and stop poor performance before it becomes a problem.
Most days this list will serve only as verification that all is good. Sometimes you may notice trends that need closer monitoring, and, in a perfect world, only on rare occasions will this report need to alert you to urgent problems.
Click through each one to get more info into environment and application logs. Get further insight into specific actions including more in-depth reporting and trace level profiling. This widget makes it very easy to get as wide-eyed or as granular as needed.
Errors aren’t easy for any of us to talk about, but we need to, if not for us, for our app. Go ahead, take a second, a deep breath, in and out. It’ll be ok, you’ll have to face your errors face-to-face, but then you’ll know how to fix them, and that’s real progress.
Error rate displays a graph of errors over time with indicators for new and regressed errors. Use this for oversight into all the exceptions in each application across different environments.
In addition, with Retrace’s Errors service, you can:
To see more information on this, see the article titled Error Dashboard.
You can also find more in-depth explanations of the custom dashboard, the included reports, and general technical information about Retrace in our technical documentation.

Stackify's APM tools are used by thousands of .NET, Java, PHP, Node.js, Python, & Ruby developers all over the world.
Explore Retrace's product features to learn more.
If you would like to be a guest contributor to the Stackify blog please reach out to [email protected]