
Software is a complex thing. As soon as you deploy an application to production—especially when you don’t have any control over the environment it’s running on—anything could happen.
You’ve created this “monster” and set if free. It’s now free from your control. How do you tame this beast before it creates havoc?
The first step is to trace its steps (no pun intended).
In order to do that, you must apply techniques that will amplify your vision, so to speak. Application logging, tracing, and profiling are the primary ways that developers can do that.
In this article, we’ll review ASP.NET tracing and how to view your tracing statements with Prefix.
According to Wikipedia,
Tracing involves a specialized use of logging to record information about a program’s execution. This information is typically used by programmers for debugging purposes, and additionally, depending on the type and detail of information contained in a trace log, by experienced system administrators or technical-support personnel and by software monitoring tools to diagnose common problems with software.
In short, tracing is the process of recording what an application did. Such information can be really useful afterward, especially for debugging and fixing issues.
With detailed tracing information, it should be possible to “go back in time”, reenacting the sequence of actions performed by the application.
You might be thinking that this sounds suspiciously like logging. You wouldn’t be the first to make that connection.
To be fair, there are many similarities between the two techniques. But they’re still different, and the next section will explore those differences.
How do tracing and logging differ?
Logging—particularly application logging—is generally used to record higher-level information. In other words, logging records events that are relevant to the business logic, or the domain of the application.
A log shouldn’t have too much noise. That would make it hard to read, parse, and extract actionable information from log entries.
On the other hand, traces can—and should—be noisier than logs. While logs provide a high-level overview of an event, tracing offers a continuous view of an app, following the progression of data in the program.
With tracing, there is much more information involved, and that’s by design.
However, the distinction between tracing and logging isn’t always that clear. Much of that is due to the fact that the approaches share tools, vocabulary, and techniques, similar to what happens with the whole “unit tests vs integration tests” debate.
For instance, by applying logging levels, it’s possible to reduce or increase the granularity of a given logger. Determining at which point the logging approach becomes “tracing” or vice-versa might still be open to debate.
With the more general definitions out of the way, it’s time to get to specifics. Let’s turn our focus to Asp.NET tracing.
Tracing is built into the .NET framework and has been available for years. Microsoft describes ASP.NET tracing as a way to view diagnostic information about a single request.
It lets you see the page’s execution path, web request details, and much more.
To enable ASP.NET tracing, you need to modify your web.config as shown below.
<configuration>
  <system.web>
    <trace enabled="true" requestLimit="40" localOnly="true" />
  </system.web>
</configuration>
If you are using MVC or Web API you also need to configure the WebPageTraceListener.
<system.diagnostics>
  <trace>
    <listeners>
      <add name="WebPageTraceListener"
            type="System.Web.WebPageTraceListener, System.Web, Version=2.0.0.0, Culture=neutral, PublicKeyToken=b03f5f7f11d50a3a"/>
    </listeners>
  </trace>
</system.diagnostics>
By default, ASP.NET collects a lot of details like cookies, headers, response status code and more. These basics can be very helpful, but being able to see your own tracing statements is even more valuable.
You can log them as multiple tracing levels. Including warnings, information, error, and just trace.
You can easily write your own tracing statements as shown in this example.
[System.Web.Http.HttpGet]
[System.Web.Http.ActionName("KitchenAsync")]
public async Task<HttpResponseMessage> KitchenAsync()
{
	Trace.WriteLine("Starting KitchenAsync - Call redis");
	await SERedisAsync();
	Trace.WriteLine("Call DB");
	await DBTestAsync();
	Trace.WriteLine("Call Webclient");
	await WebClientAsync();
	Trace.WriteLine("Finished KitchenAsync");
	return Request.CreateResponse(HttpStatusCode.OK, Guid.NewGuid().ToString());
}
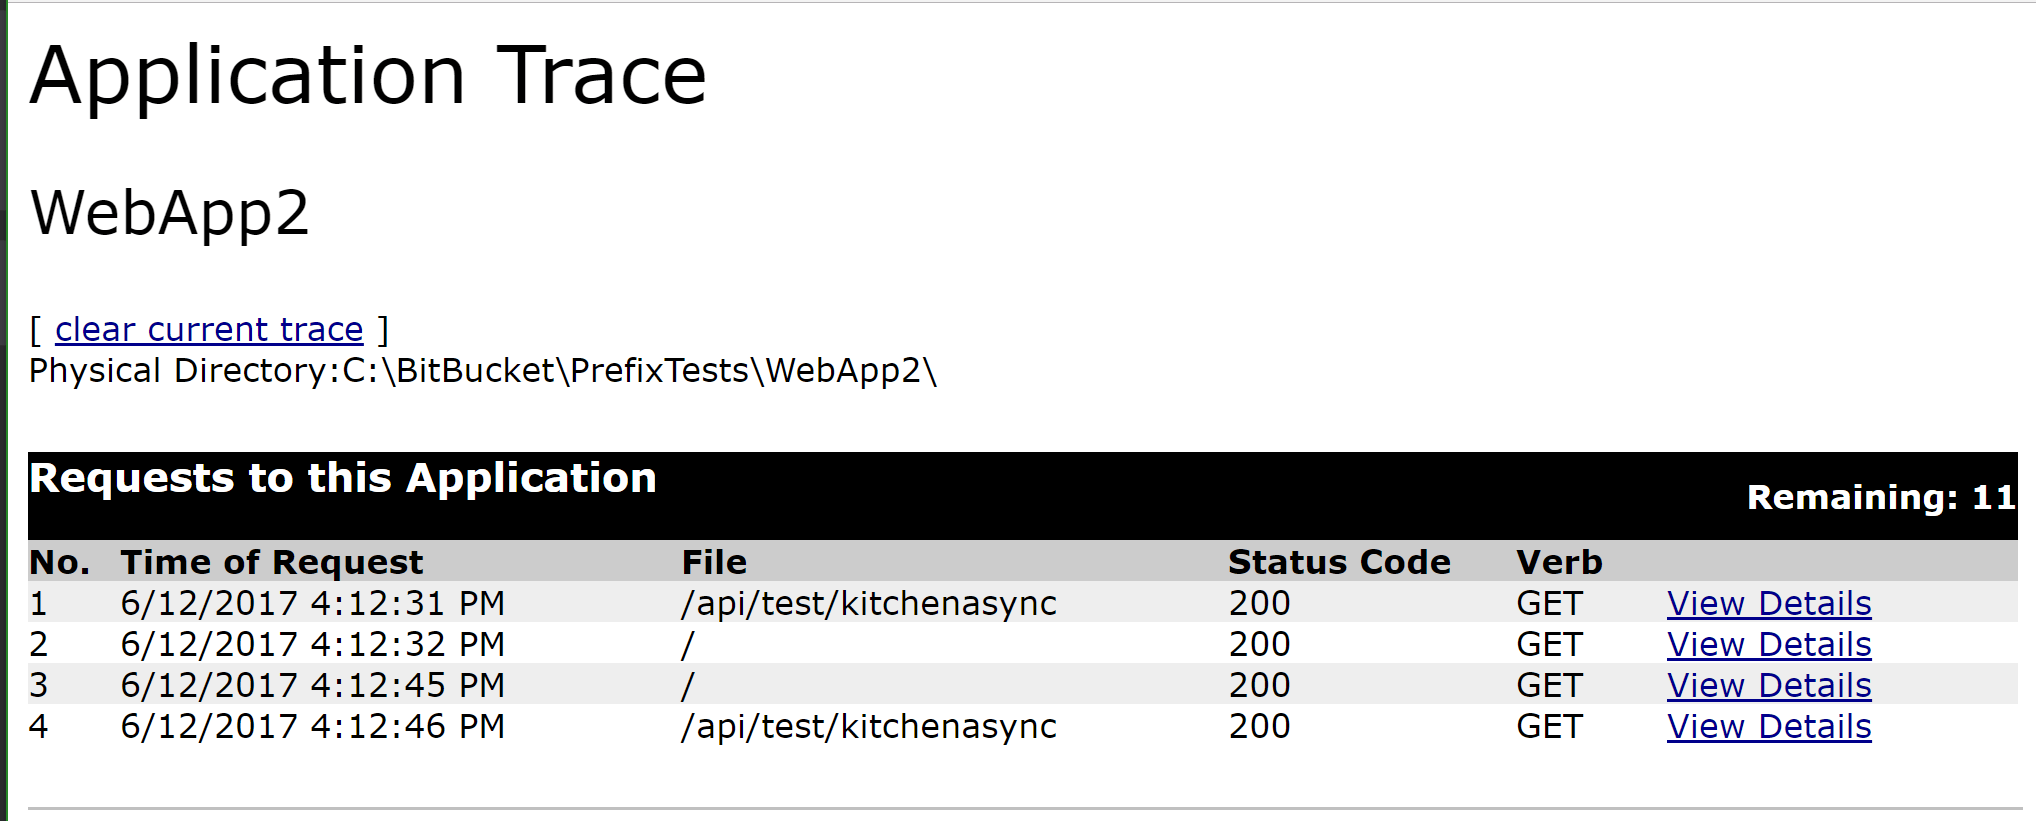
Built into ASP.NET is a trace viewer. You can access it via your web browser by going to /trace.axd within your application.
This will load a list of the most recent web requests.
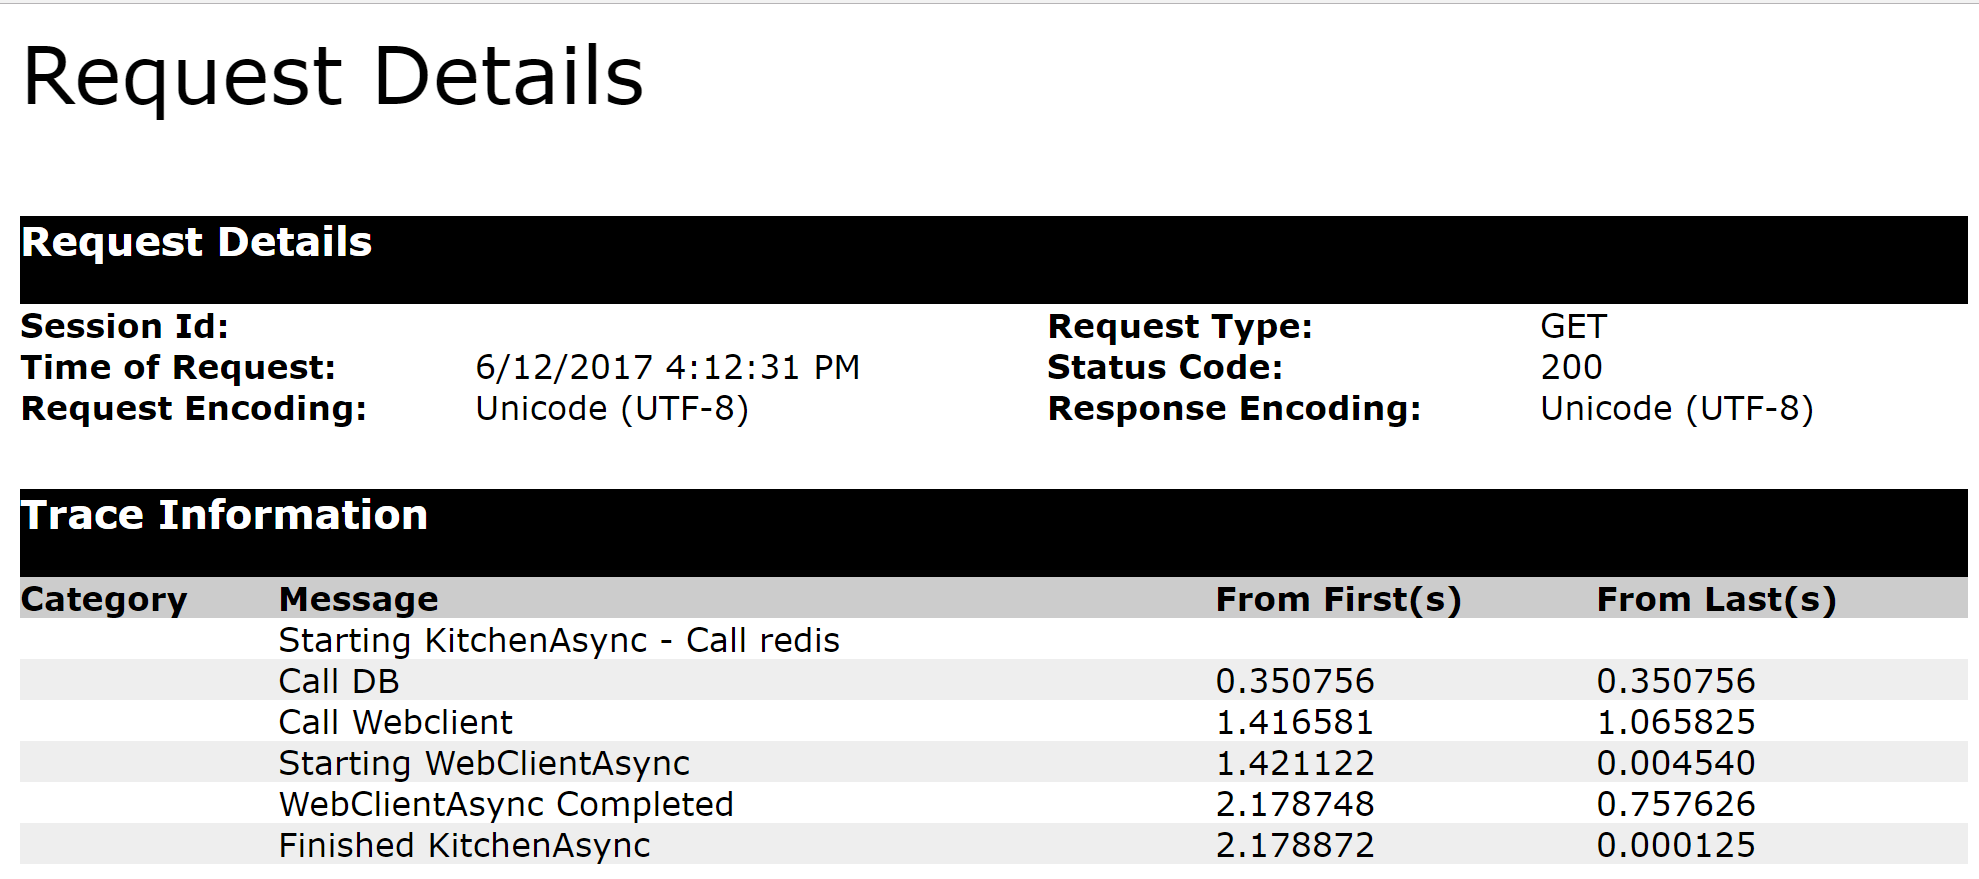
By clicking “View Details” you can view what is captured for a specific web request.
Here is an example of the one from the C# code above. You can see the Trace.WriteLine messages that were logged.
The built in view for ASP.NET tracing is pretty cool. However, if you want the ultimate experience, you want Prefix.
Prefix is a free developer tool from Stackify. It is installed on your workstation and runs as a lightweight ASP.NET profiler.
It tracks key methods being called by your code and provides an excellent user interface to view .NET traces, logs, SQL queries, exceptions, and much more.
Prefix automatically tracks hundreds of key methods across dozens of common frameworks and dependencies.
Things like SQL Server, mongodb, redis, etc. To view a complete list of what Prefix tracks, please visit our docs.
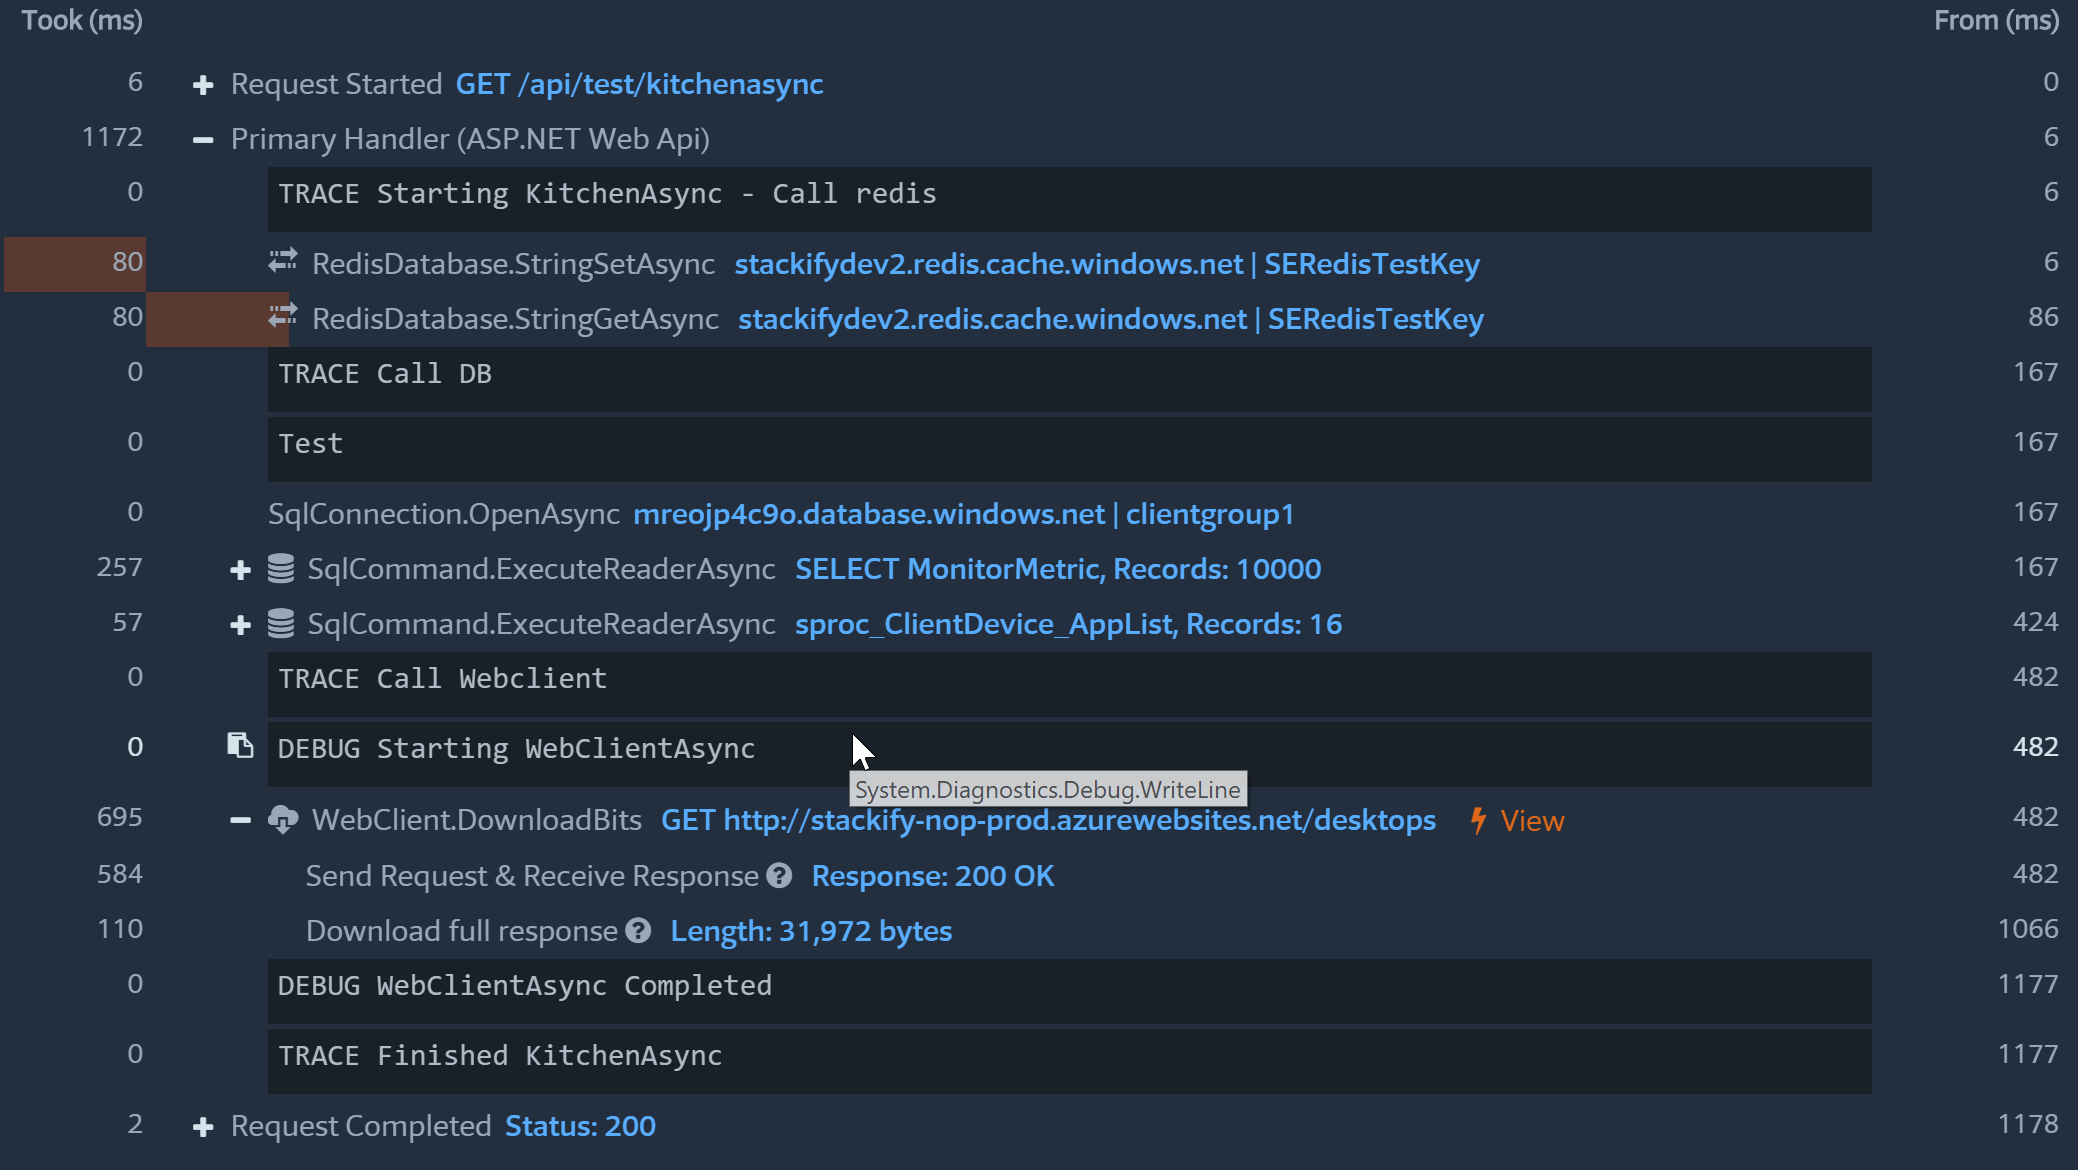
Prefix collects a lot of similar details as the standard ASP.NET trace view. It also includes way more details.
Not only does it automatically pick up the Trace.WriteLine statements, it also supports Debug.WriteLine and logging statements via popular logging frameworks like log4net, NLog, etc.
You can also see how the code interacts with Redis, 2 SQL queries, and an external HTTP web service call.
Understanding what your code is doing is essential to validate that your code works. Tools like Prefix help answer that critical question of “what did my code just do?”.
Prefix gives you instant visibility to what your code is doing, way beyond just basic ASP.NET tracing.
Prefix is an amazing tool that is free to download! It shows off the power of lightweight ASP.NET profiling. You can get this same type of functionality with Stackify Retrace for your servers.
Stackify's APM tools are used by thousands of .NET, Java, PHP, Node.js, Python, & Ruby developers all over the world.
Explore Retrace's product features to learn more.


