IIS Error Logs and Other Ways to Find ASP.Net Failed Requests
By: mwatson
| July 27, 2023

As exciting as it can be to write new features in your ASP.NET Core application, our users inevitably encounter failed requests. Do you know how to troubleshoot IIS or ASP.NET errors on your servers? It can be tempting to bang on your desk and proclaim your annoyance.
However, Windows and ASP.NET Core provide several different logs where failed requests are logged. This goes beyond simple IIS logs and can give you the information you need to combat failed requests.
Get to Know the 4 Different IIS Logs
If you have been dealing with ASP.NET Core applications for a while, you may be familiar with normal IIS logs. Such logs are only the beginning of your troubleshooting toolbox.
There are some other places to look if you are looking for more detailed error messages or can’t find anything in your IIS log file.
1. Standard IIS Logs
Standard IIS logs will include every single web request that flows through your IIS site.
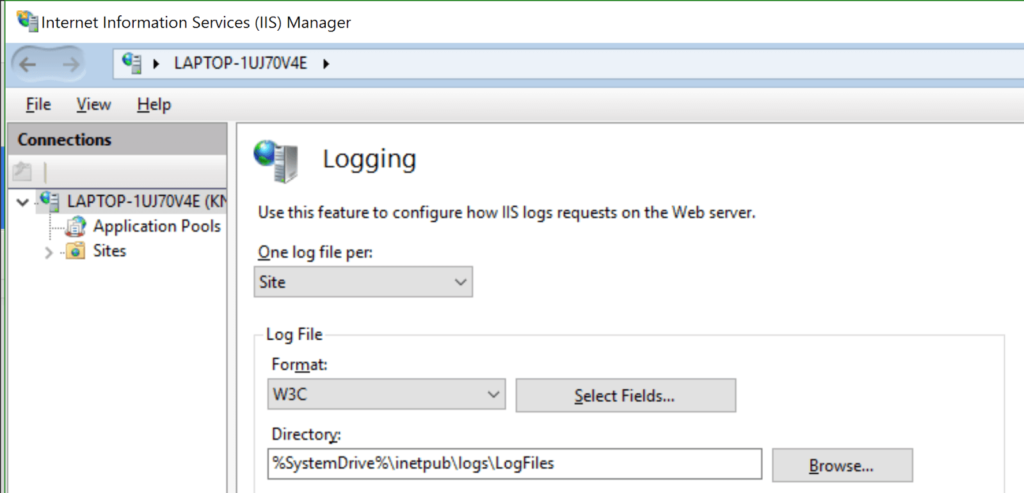
Via IIS Manager, you can see a “Logging” feature. Click on this, and you can verify that your IIS logs are enabled and observe where they are being written to.

You should find your logs in folders that are named by your W3SVC site ID numbers.
Need help finding your logs? Check out: Where are IIS Log Files Located?
By default, each logged request in your IIS log will include several key fields including the URL, querystring, and error codes via the status, substatus and win32 status.
These status codes can help identify the actual error in more detail.
#Fields: date time s-ip cs-method cs-uri-stem cs-uri-query s-port cs-username c-ip cs(User-Agent) cs(Referer) sc-status sc-substatus sc-win32-status time-taken
2019-09-13 21:45:10 ::1 GET /webapp2 - 80 - ::1 Mozilla/5.0 - 500 0 0 5502
2019-09-13 21:45:10 ::1 GET /favicon.ico - 80 - ::1 Mozilla/5.0 http://localhost/webapp2 404 0 2 4
The “sc-status” and “sc-substatus” fields are the standard HTTP status code of 200 for OK, 404, 500 for errors, etc.
The “sc-win32-status” can provide more details that you won’t know unless you look up the code. They are basic Win32 error codes.
You can also see the endpoint the log message is for under “cs-uri-stem”. For example, “/webapp2.” This can instantly direct you to problem spots in your application.
Another key piece of info to look at is “time-taken.” This gives you the roundtrip time in milliseconds of the request and its response.
By the way, if you are using Retrace, you can also use it to query across all of your IIS logs as part of its built-in log management functionality.
2. Can’t Find Your Request in the IIS Log? HTTPERR is Your IIS Error Log.
Every single web request should show in your IIS log. If it doesn’t, it is possible that the request never made it to IIS, or IIS wasn’t running.
It is also possible IIS Loggin is disabled. If IIS is running, but you still are not seeing the log events, it may be going to HTTPERR.
Incoming requests to your server first route through HTTP.SYS before being handed to IIS. These type of errors get logged in HTTPERR.
Common errors are 400 Bad Request, timeouts, 503 Service Unavailable and similar types of issues. The built-in error messages and error codes from HTTP.SYS are usually very detailed.
Where are the HTTPERR error logs?
C:\Windows\System32\LogFiles\HTTPERR
3. Look for ASP.NET Core Exceptions in Windows Event Viewer
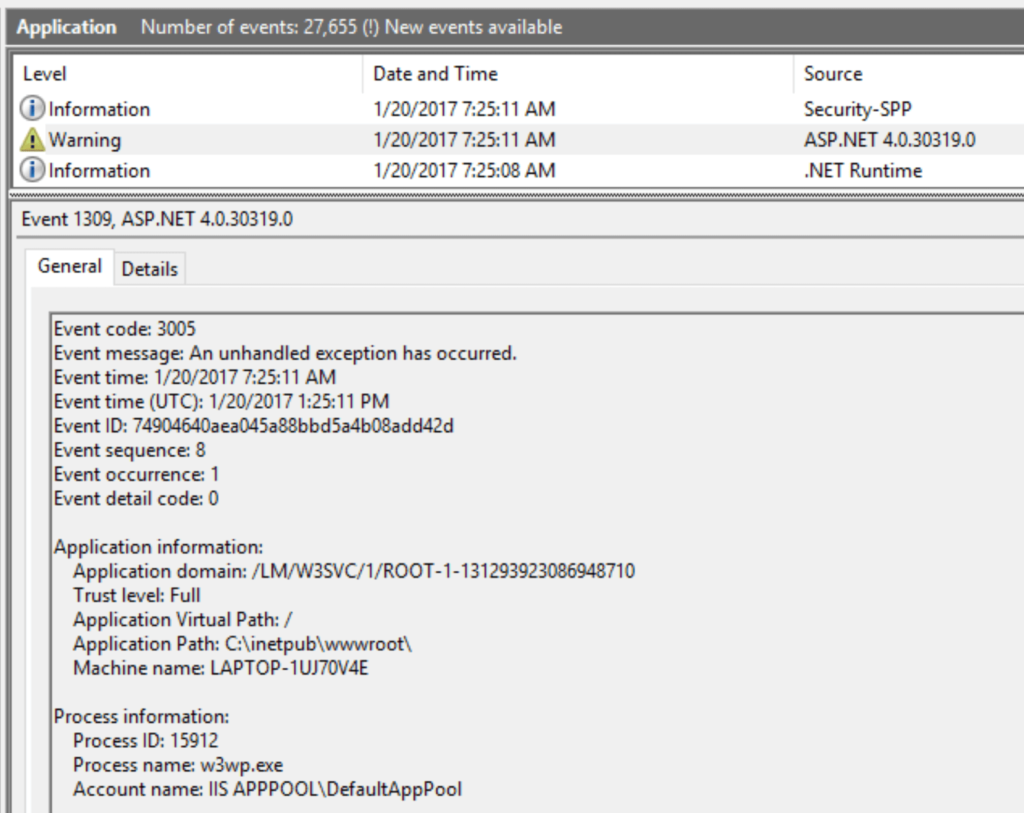
By default, ASP.NET Core will log unhandled 500 level exceptions to the Windows Application EventLog. This is handled by the ASP.NET Core Health Monitoring feature. You can control settings for it via system.web/healthMonitoring in your appsettings.json file.
Very few people realize that the number of errors written to the Application EventLog is rate limited. So you may not find your error!
By default, it will only log the same type of error once a minute. You can also disable writing any errors to the Application EventLog.

Can’t find your exception?
You may not be able to find your exception in the EventLog. Depending on if you are using WebForms, MVC, Core, WCF or other frameworks, you may have issues with ASP.NET Core not writing any errors at all to ASP.NET due to compatibility issues with the health monitoring feature.
By the way, if you install Retrace on your server, it can catch every single exception that is ever thrown in your code. It knows how to instrument into IIS features.
Also Read-https://stackify.com/nhibernate-profiler-sql-query-performance/
4. Failed Request Tracing for Advanced IIS Error Logs
Failed request tracing (FRT) is probably one of the least used features in IIS. It is, however, incredibly powerful.
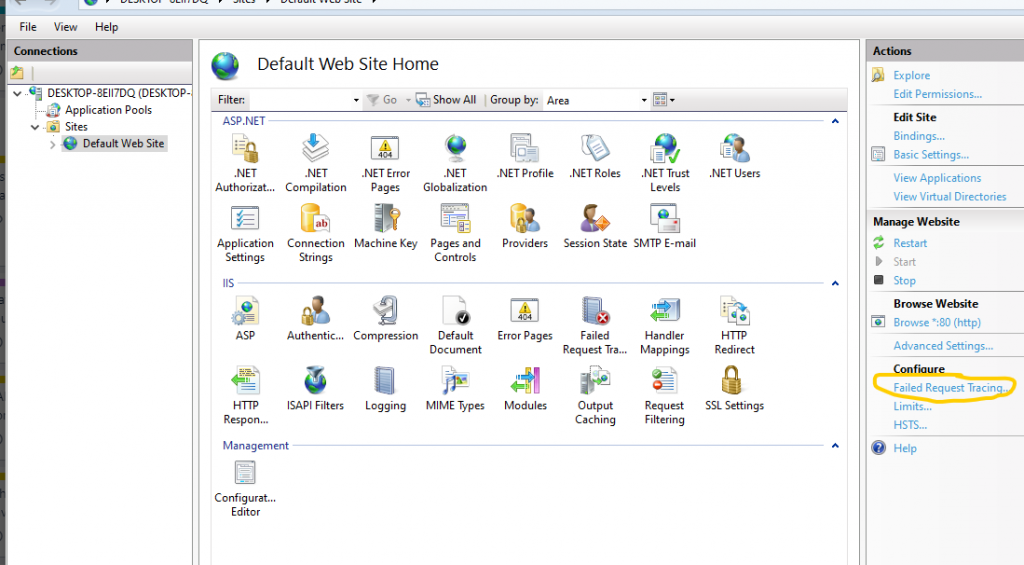
It provides robust IIS logging and works as a great IIS error log. FRT is enabled in IIS Manager and can be configured via rules for all requests, slow requests, or just certain response status codes.
You can configure it via the “Actions” section for a website:

The only problem with FRT is it is incredibly detailed. Consider it the stenographer of your application. It tracks every detail and every step of the IIS pipeline. You can spend a lot of time trying to decipher a single request.
5. Make ASP.NET Core Show the Full Exception…Temporarily
If other avenues fail you and you can reproduce the problem, you could modify your ASP.NET Core appsettings.json to see exceptions.
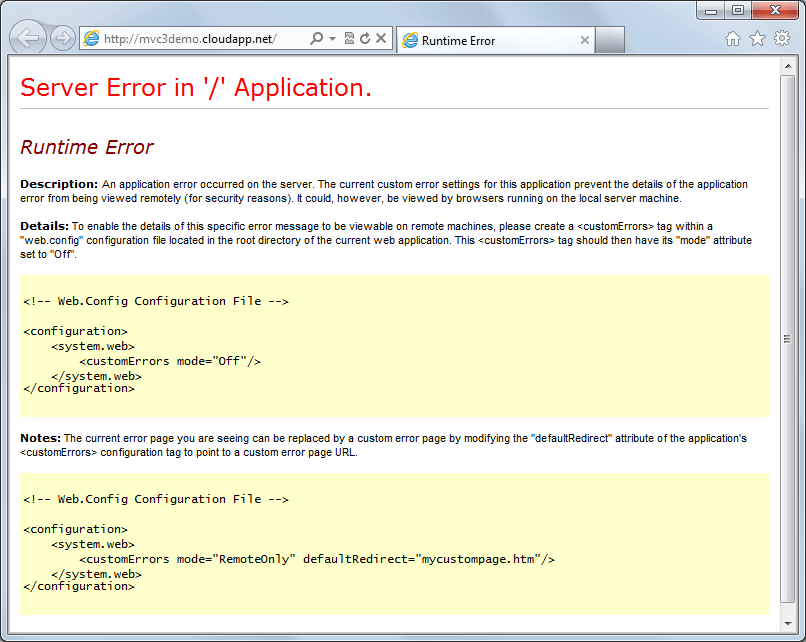
Typically, server-side exceptions are disabled from being visible within your application for important security reasons. Instead, you will see a yellow screen of death (YSOD) or your own custom error page.
You can modify your application config files to make exceptions visible.

ASP.NET
You could use remote desktop to access the server and set customErrors to “RemoteOnly” in your web.config so you can see the full exception via “localhost” on the server. This would ensure that no users would see the full exceptions but you would be able to.
If you are OK with the fact that your users may now see a full exception page, you could set customErrors to “Off.”
.NET Core
Compared to previous versions of ASP.NET, .NET Core has completely changed how error handling works. You now need to use the DeveloperExceptionPage in your middleware.
.NET Core gives you unmatched flexibility in how you want to see and manage your errors. It also makes it easy to wire in instrumentation like Retrace.

6. Using a .NET Profiler to Find ASP.NET Core Exceptions
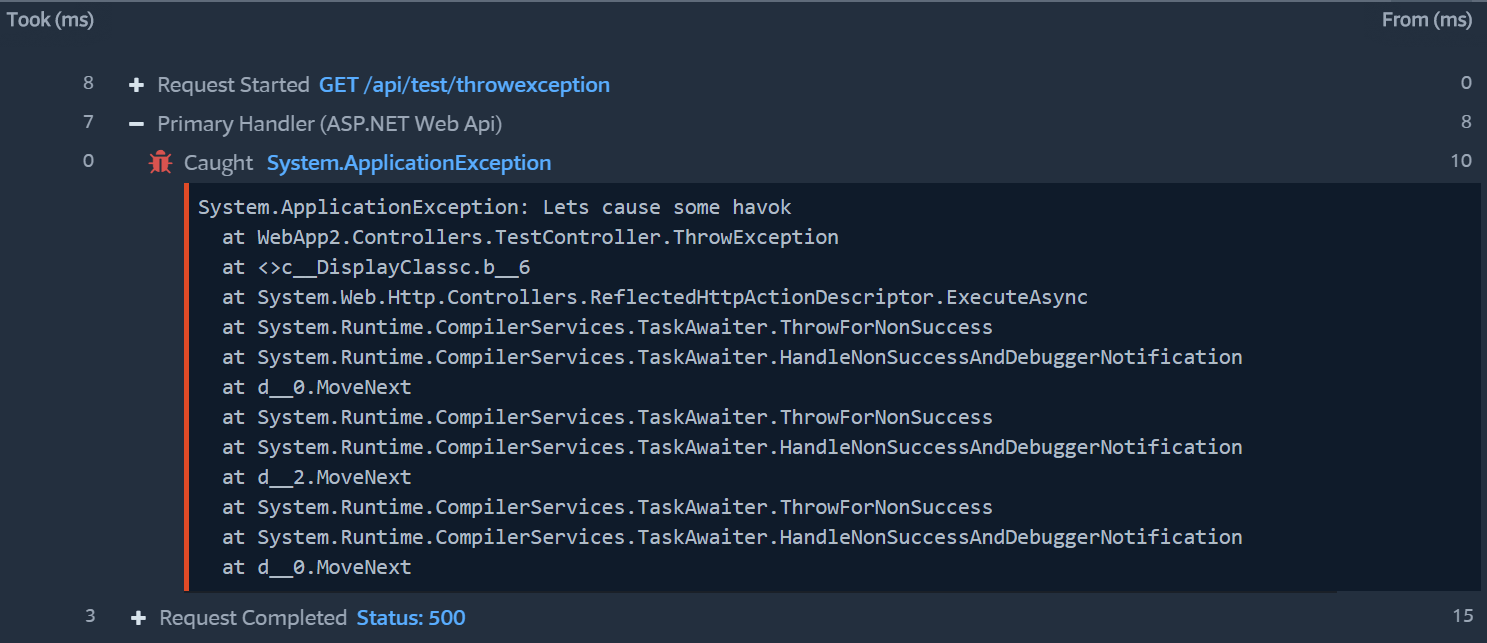
.NET Profilers like Prefix (which is free!) can collect every single exception that is .NET throws in your code even if they are hidden in your code.
Prefix is a free ASP.NET Core profiler designed to run on your workstation to help you optimize your code as you write it. Prefix can also show you your SQL queries, HTTP calls, and much, much more.

Get Proactive About Tracking Application Errors!
Trying to reproduce an error in production or chasing down IIS logs/IIS error logs is not fun. Odds are, there are probably many more errors going on that you aren’t even aware of. When a customer contacts you and says your site is throwing errors, you better have an easy way to see them!
Tracking application errors is one of the most important things every development team should do. If you need help, be sure to try Retrace which can collect every single exception across all of your apps and servers.

Also, check out our detailed guide on C# Exception Handling Best Practices.
If you are using Azure App Services, also check out this article: Where to Find Azure App Service Logs.
Improve Your Code with Retrace APM
Stackify's APM tools are used by thousands of .NET, Java, PHP, Node.js, Python, & Ruby developers all over the world.
Explore Retrace's product features to learn more.
Learn More
