
.NET Profilers are a developer’s best friend when it comes to optimizing application performance. They are especially critical when doing low level CPU and memory optimizations. But did you know that there are three different types of profilers?
All are very valuable but serve relatively different purposes and different types of performance profiling. Let’s explore the different types.
These tools include CLR profiler products like Visual Studio’s .NET profiler, ANTS, dotTrace, SciTech and YourKit.
Most likely if you are using a profiler of some form, you are having a bad day. It usually means you are chasing some bad CPU or memory usage problems. I’ve had my fair share of multi-day marathon profiling sessions trying to find obscure memory leaks. These tools are a lifesaver when you need them, but they are very resource intensive and slow you down when using them.
I would venture to guess that the vast majority of developers have never or very rarely use these types of profilers. These simply aren’t needed day to day for apps that a lot of developers create.
Traditional usage scenarios for a .NET profiler:
A standard .NET profiler works by using the .NET CLR profiling interface. This allows profiling the .NET MSIL bytecode at a low level to understand each operation your code performs. This enables them to show you the “hot path” within your code to see which methods are using the most CPU.
You can then typically drill down to even which line of code in your app is using the most CPU. This can be a huge lifesaver when you are having one of those bad days and need to urgently find the problem.
We proactively use the Visual Studio Profiler and ANTS to tune the performance of our Windows monitoring agent. Our goal is to add as little overhead as possible on the servers of our customers. We have also had to use them to chase down some weird memory leaks.
List of popular .NET Profilers
MORE: How to Troubleshoot High .NET App CPU in Production With ANTS and Process Hacker
Screenshot from Visual Studio profiler showing performance down to the code level

Lightweight profilers are more geared towards tracking the high level performance of your app. They help you understand total page load time, which database calls were executed, etc.
These tools are designed to help developers every single day. They are designed to not have a huge performance impact on your code so they can always be on.
There are three primary tools available to .NET developers that all work as ASP.NET Profilers. They are all very different in how they are implemented, how they work, and the types of information they can provide. Below is a real fast review and comparison.
These types of profilers are more designed around individual web requests or transaction tracing. This makes them very useful for tracking how long specific web requests take and why they are taking that long.
They can save a ton of time compared to writing a bunch of custom logging or debugging your code. They can put a lot of good information at your fingertips once they are setup. Every developer should have one of these tools in their toolbox.
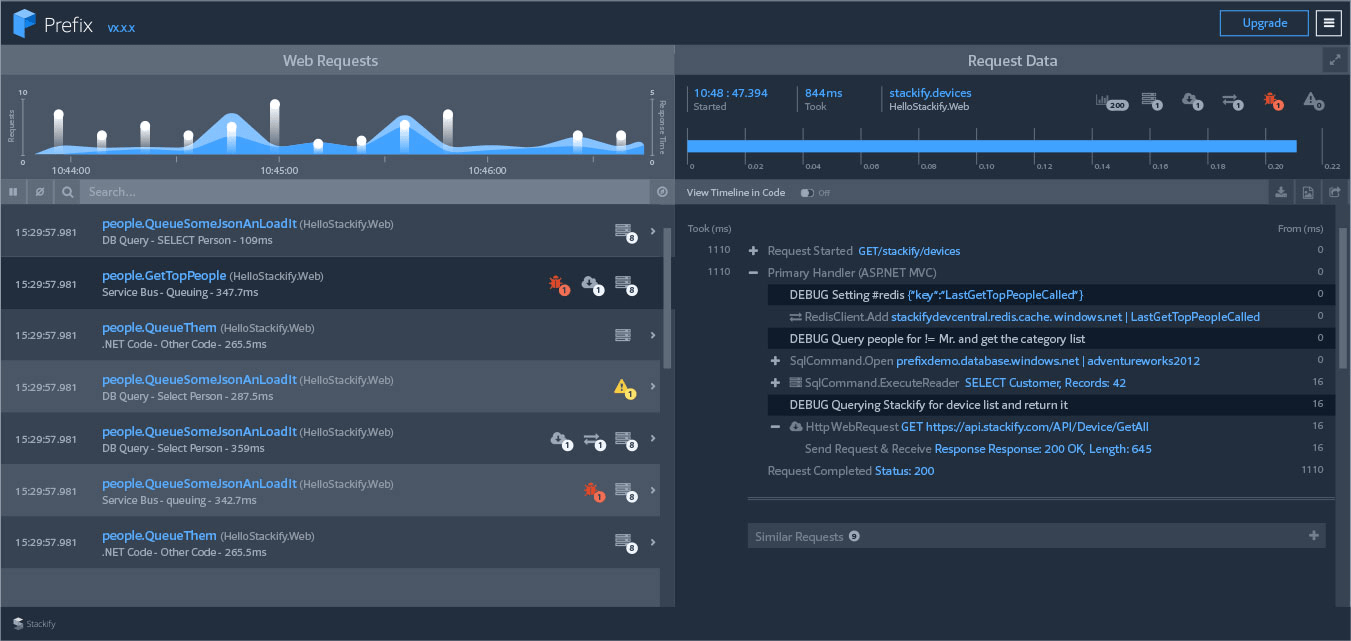
Prefix is an amazing free tool. It is extremely easy to install and it just works with no headaches, code changes, or config changes. It is very lightweight and designed to be used every day. We have many users who leave it open on their second monitor all the time.
Sample screenshot of Prefix, Stackify’s free tool
These tools include products like New Relic, AppDynamics, Stackify Retrace, Dynatrace, and others.
Normal profilers are designed as developer tools that are used on their workstations. The same sort of technology is used on servers but must be very lightweight so it doesn’t slow down production applications. Stackify’s Retrace APM and Prefix use the same exact lightweight profiling technology for both.
The other key feature for profiling production apps is aggregating performance details across all transactions, app, and servers so you can easily understand application performance.
Reproducing application problems in QA or dev environments is usually a nightmare. One of the great things about APM products is they usually collect enough details to quickly identify and resolve most common application problems. Products like Stackify APM can show the exact database queries, logging, exceptions, web service calls and so much more to understand how to fix bugs or improve application performance.
The biggest problem with APM solutions is their pricing. They have traditionally been so expensive that only the largest enterprises could afford them. It doesn’t make a lot of sense to spend $100 a month on a server at Azure or AWS and then spend another $150 a month for a product like New Relic. Monitoring tools shouldn’t cost more than the servers!
Stackify Retrace is a very affordable APM solution that includes server monitoring, error tracking and log management for that price. However, the benefits of Retrace over New Relic go beyond pricing. Check out this quick comparison of features between the two.
Want even more power to write better code faster and catch any issues before they get to production?


Profilers are powerful tools for measuring and improving the performance of your apps in development and production both. I would highly recommend getting familiar with all three types of the .NET profilers mentioned in this article. They are tools that you should always have in your toolbox.
Stackify's APM tools are used by thousands of .NET, Java, PHP, Node.js, Python, & Ruby developers all over the world.
Explore Retrace's product features to learn more.


