
Developers love tools, and they tend to use a lot of them. Many of them are such a normal part of our daily lives and toolchain that we don’t even think of them as tools anymore.
Your computer, the Internet, a simple text editor, and source code repositories are a good example of this. They are just fundamental things we use every day.
Developers now have access to free and inexpensive application profiling tools that can help find and fix many common application problems. These new tools are now an essential part of every developer’s tool set.
None of us enjoy firefighting production application problems. We would much rather be working on some awesome new feature for our app. So, let’s learn how to prevent production fires!
Let’s start out by saying nobody writes perfect code, and you can never prevent every unforeseen scenario. However, with a little more visibility into what your code is doing, you can find a lot of common problems early on. Light-weight application profiling at the code-level provides the visibility that you need.
Fact: The best time to find bugs is when you are creating them.
Finding, reproducing, and fixing bugs in production is hard, slow, and expensive. The earlier we can find them in the development cycle the better, of course.
You just joined a new team and you are trying to help fix some bugs and add some new features to an existing project. You have no idea what any of the code does. Sounds like fun, right?
Many apps have complicated layers of authentication, data access, integrations, etc. Not to mention the dozens of AJAX calls that can occur in modern web apps. It can be very hard to understand what your code is doing under the hood.
How do you know what database queries, web service calls, cache hits, exceptions and more are happening?
Thanks to detailed transaction profiling, which is powered by lightweight code profilers or other technology, you can easily see these types of details and more.
Screenshot from Prefix (free for ASP.NET & Java developers)
Depending on which programming language you are using, there are several different application profiling tools you could use for this. The features and functionality of these tools vary wildly. Some require a lot of code changes or configuration, some don’t require any.
These developer tools are primarily designed to run on your workstation, although some may also work on a server. There are a lot of different types of software profilers.
All of these are free except for the ones denoted paid. If I missed a tool, please let us know in the comments below and we will add it!
These types of software profiling tools are a lifesaver. Once you start using them, they will become part of your standard tool-chain. They are really good at answering that question of “What did my code just do?”
Using Prefix as an example, it can collect a ton of awesome details about what a single web request is doing. It is pretty amazing to see all of your logging statements along with all of the other details it collects like SQL queries, etc.
Prefix can do all of this without even changing your code!
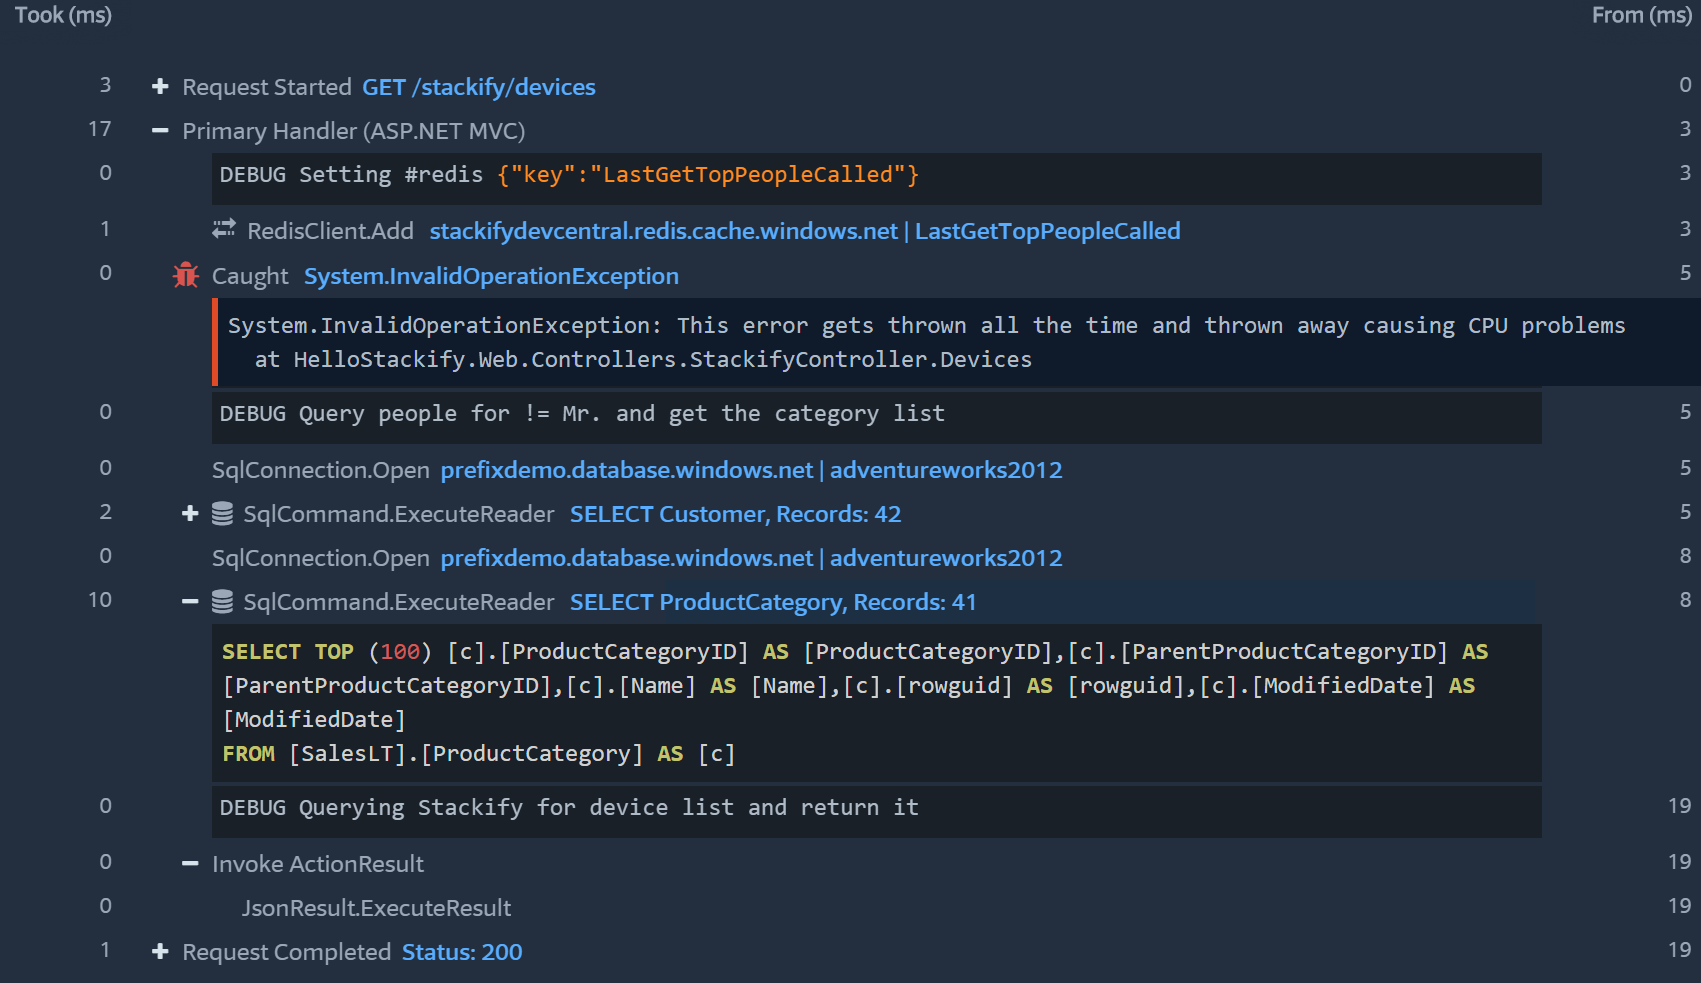
This type of view makes it very easy to see what SQL queries are being executed and how long they take. You can quickly copy a query and rerun it in your SQL management tool.
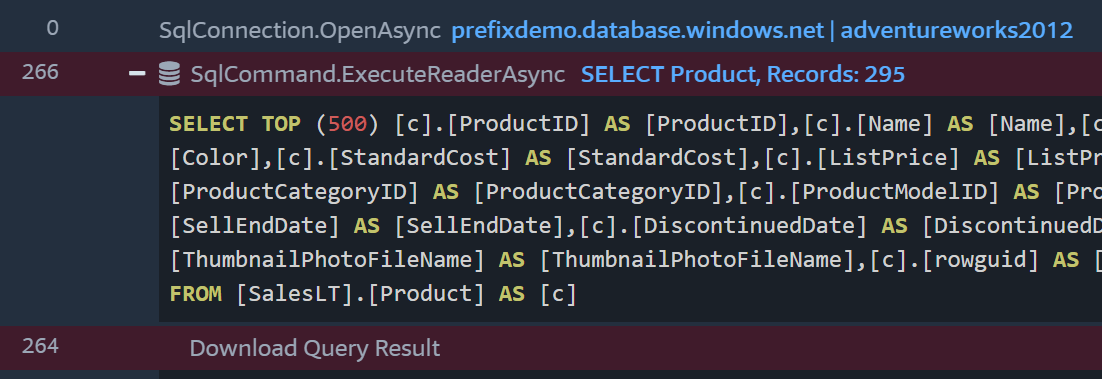
You can even use it to help find common N+1 type problems that come from running SQL queries within a loop.
So far we have talked a lot about using tools that do code-level performance profiling to help find bugs and improve your code as you are writing and testing it on your workstation.
What happens once you deploy your app to QA?
For most developers, understanding what their code is doing after it gets deployed is mostly a black box. If they are lucky they might be able to get access to some log files or remote access to the server.
How do you get the same transaction tracing details on your servers?
Some of the tools mentioned above can work on your servers to give you a trace, but they could cause huge a performance overhead.
To easily view transaction traces across every user, server, and app, you really need an APM solution. APM, or application performance management, typically runs as a lightweight performance profiler to collect the same sort of details as the tools mentioned above. APM solutions are designed to have very low overhead and even run on high traffic production servers.
Traditionally, APM tools can be very expensive and are not affordable to smaller companies or teams, especially when talking about running APM in non-production environments. Luckily, Retrace APM is just $10 a month per server when used in non-production environments.
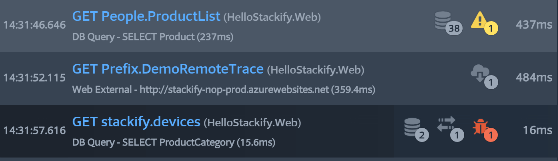
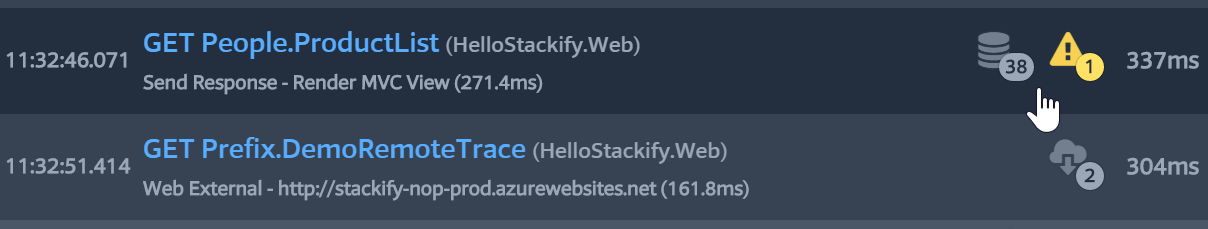
Example transaction trace below was recorded by Retrace’s application profiling. It shows logging, Redis access, and SQL queries.
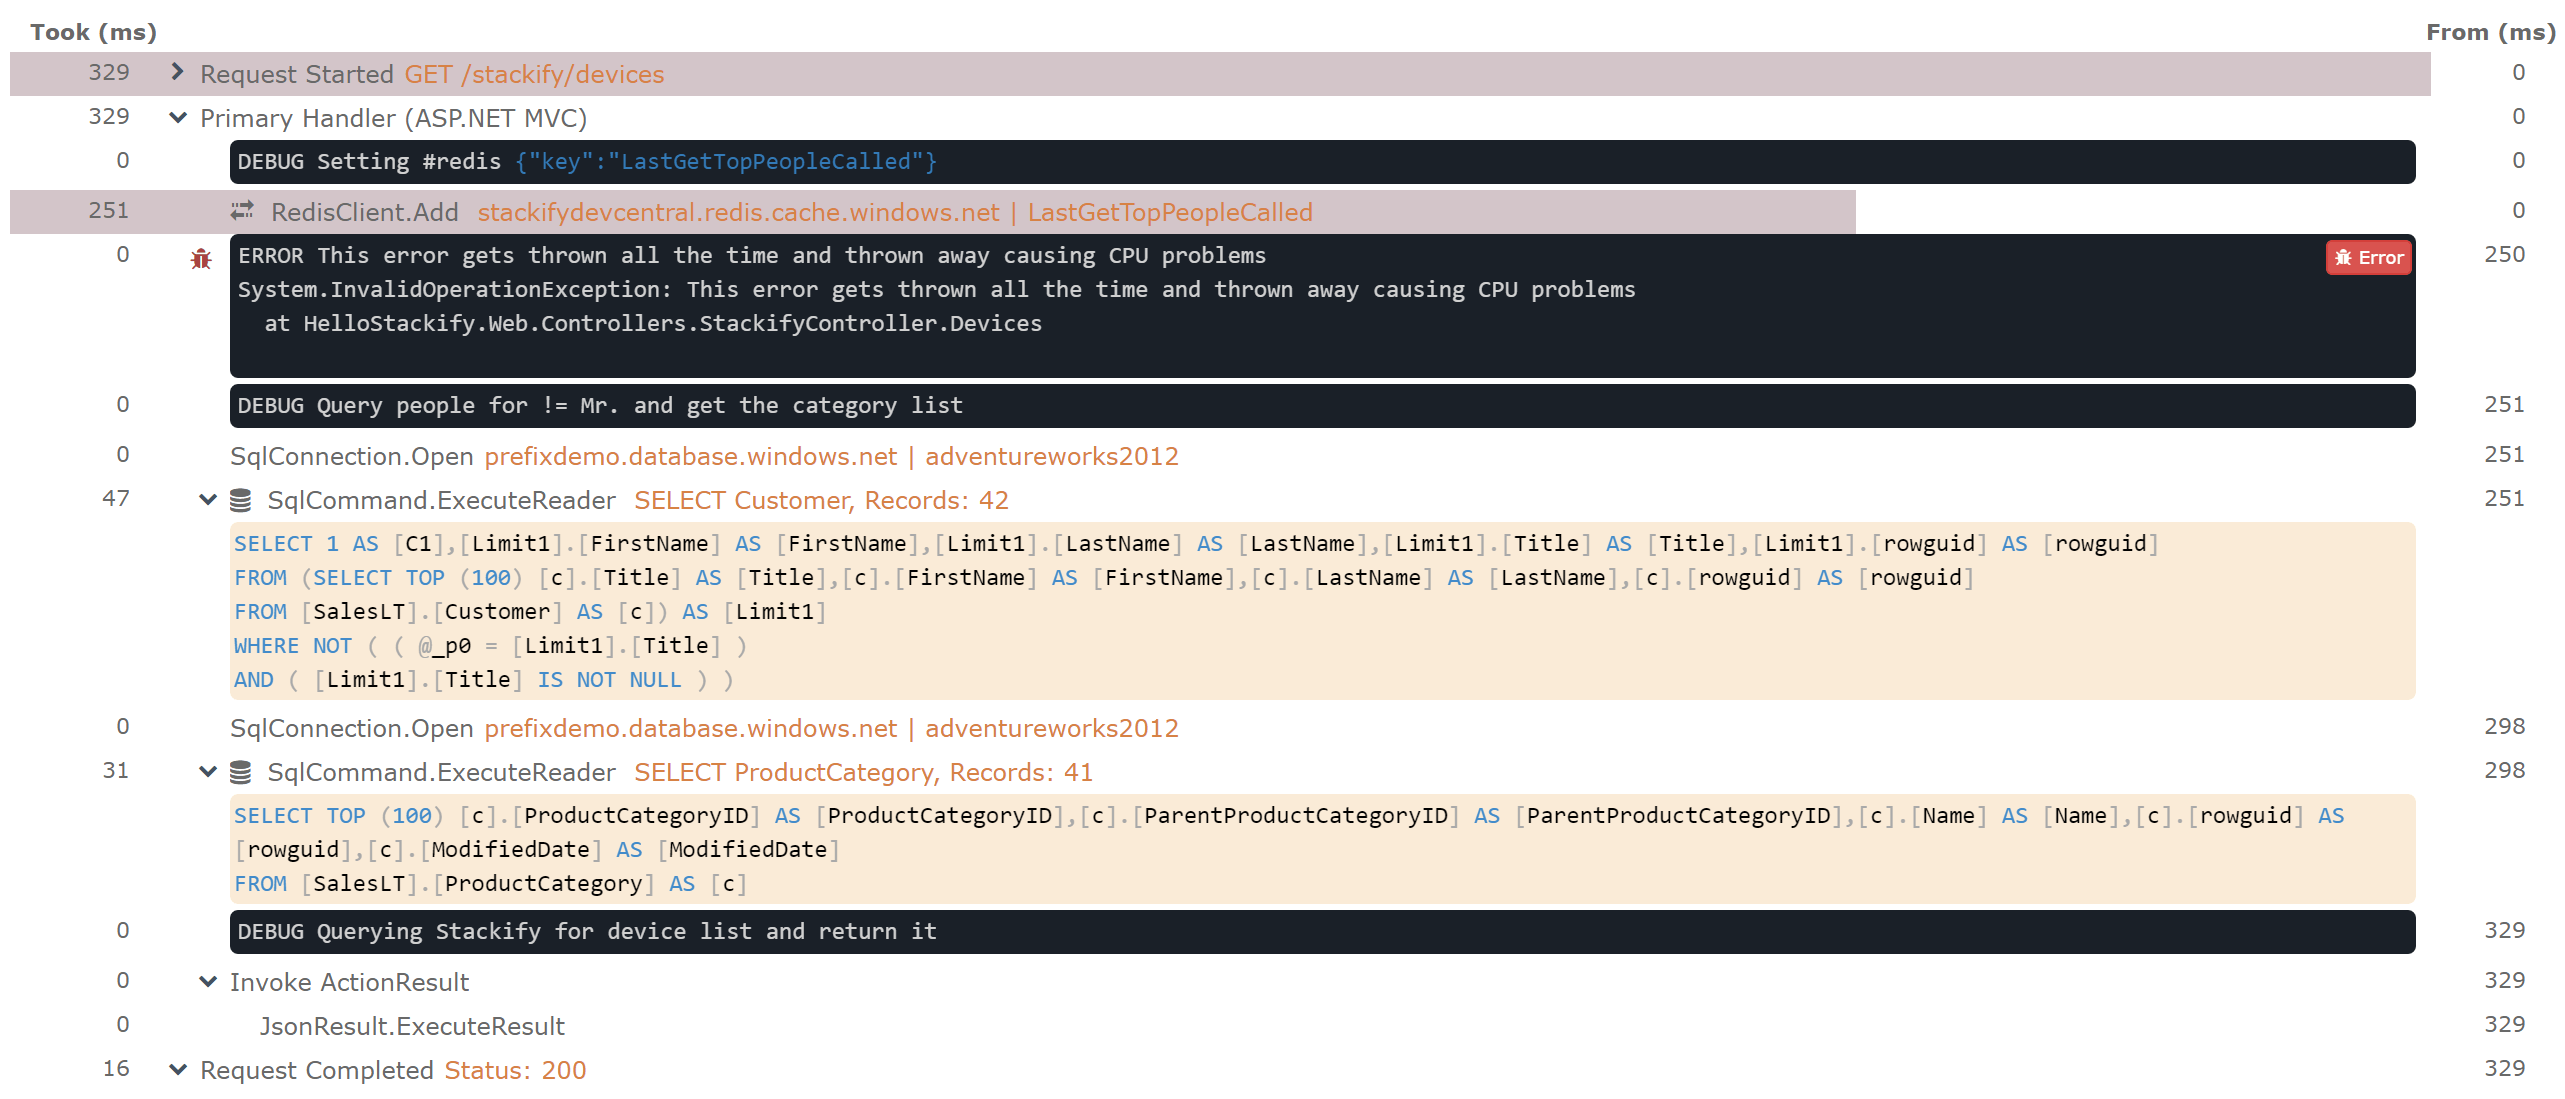
APM solutions provide aggregate reporting across all of your apps and servers so you can really analyze and understand performance. Here are some things that you should be looking for:
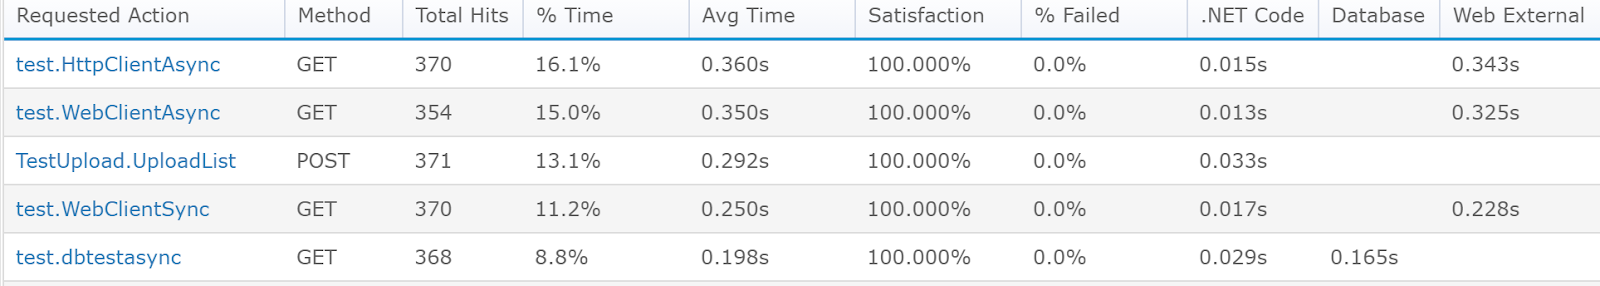
Sadly, “works on my machine” does not always translate to success when your code gets to QA. Generate some good traffic against your code changes to ensure it is performing well and working correctly.
Review how long requests are taking. Ensure that performance is in line with expectations and look for ways to improve it. Lightweight performance profiling is very valuable for find performance problems.
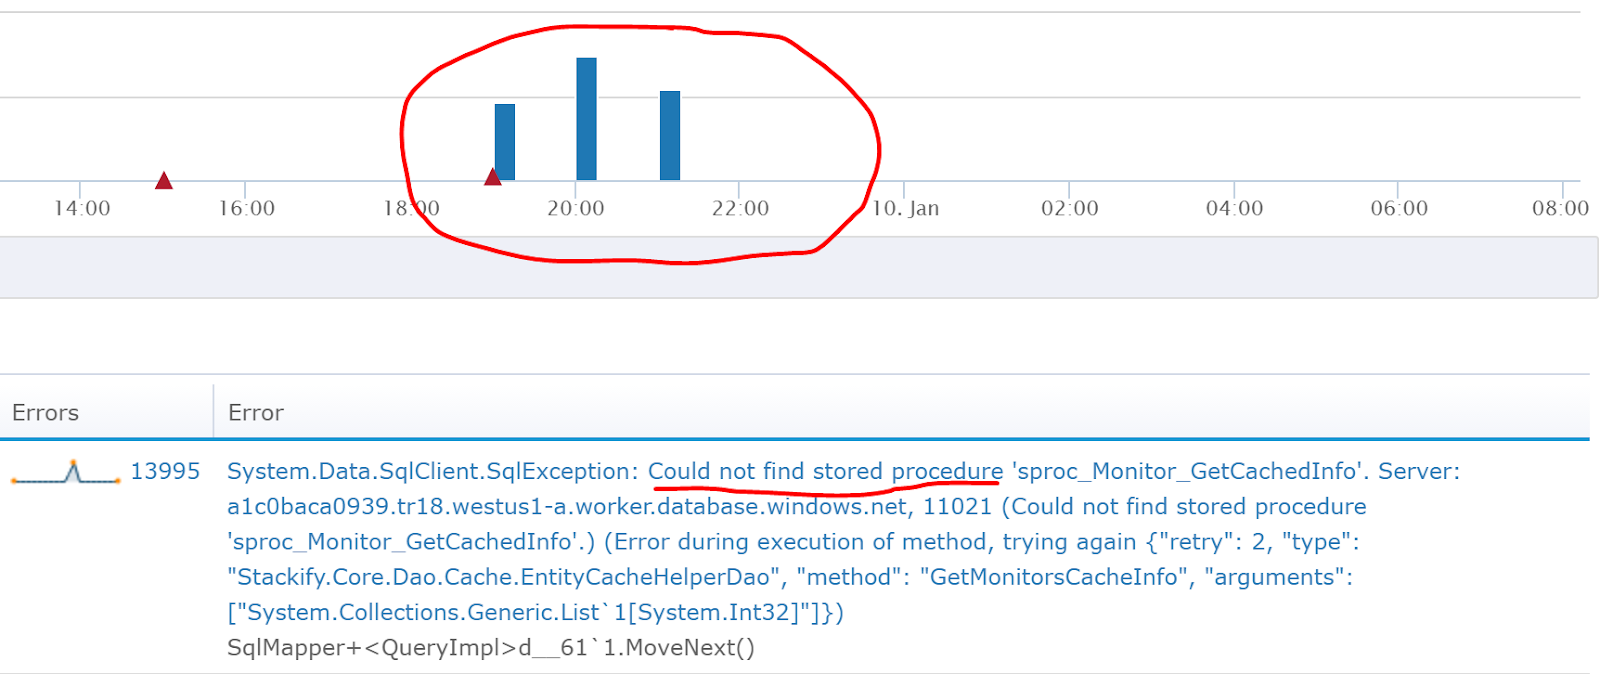
Application errors can happen for a lot of reasons. Sometimes they are just transient noise. But many times, they can be our first line of defense when it comes to identifying potential problems.
After every development, it is a really good idea to always look for new and regressed errors. In this example, we can quickly see that after a deployment we were missing a stored procedure that caused a ton of new exceptions.
It is hard to really know how fast or how slow a SQL query is going to be until you test it against a large set of real data and a high enough volume concurrently to see how it performs.
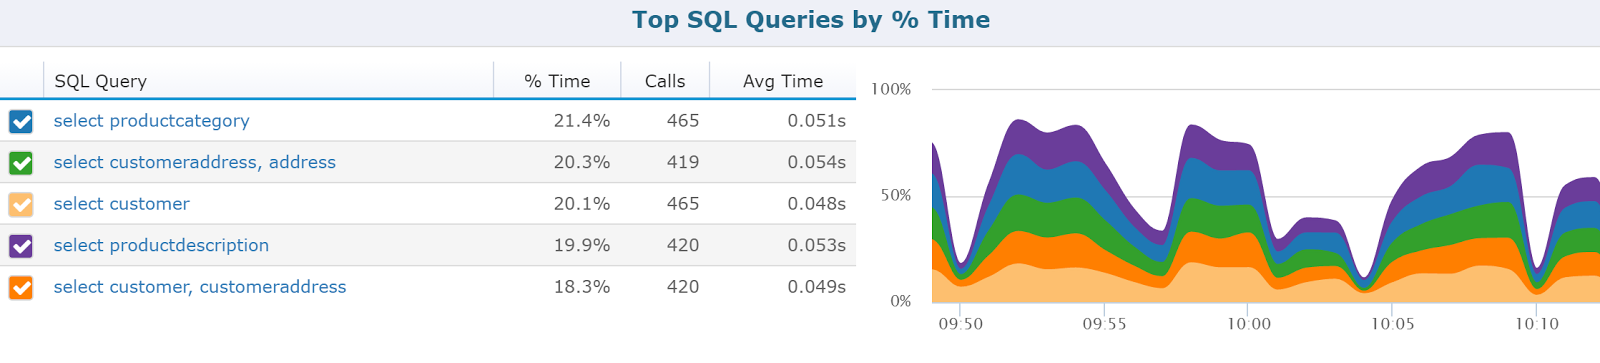
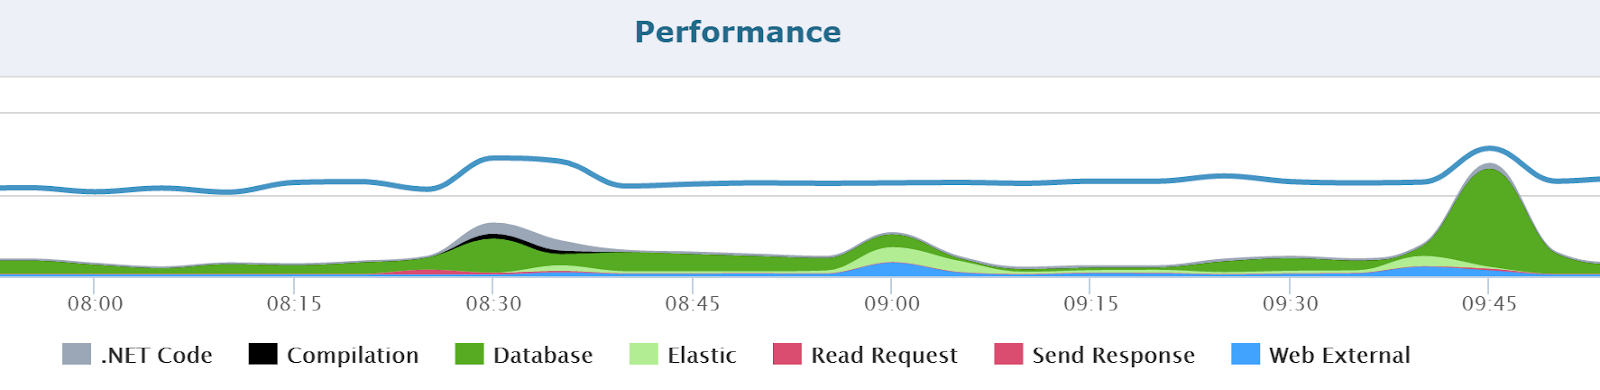
Today’s applications are highly dependent on a lot of external services, beyond just a simple database. Apps typically do a lot of web service calls, caching, queuing, and much more.
It is important to understand how these dependencies perform and scale before getting to production. In this example, we can see a big spike in response times around 9:45 due to SQL database queries.
Free and inexpensive developer tools can give you constant feedback and insight into your applications. Based on the examples shown in this post, I hope you that you see how valuable application profiling tools like Prefix and Retrace can be.
By using them through every step of the lifecycle, you can improve your team’s velocity, increase the quality of your production code, and dramatically reduce the risk of a bad release.
Ultimately, you can spend more time building valuable software and spend less time triaging bad code that could be improved well before it was released into production.
The beauty of it all is that you can do it affordably and as a byproduct of work you’re already doing!
Stackify's APM tools are used by thousands of .NET, Java, PHP, Node.js, Python, & Ruby developers all over the world.
Explore Retrace's product features to learn more.


