So you want a faster application? If you’ve not heard of a flamegraph, it can be a great way to improve and gain insight into your application performance.
Today, we’ll explain what a flamegraph is. We’ll cover the stack trace and its origin, the call stack. Finally, we’ll define the flame graph and show how to leverage it for improving the performance of your application.
Sound good? Let’s get to it.
Before we get to what a flamegraph is, we need to discuss stack traces. The concepts of stack traces are foundational to understanding flamegraphs, so let’s take a moment to familiarize ourselves first.
To begin, let’s take a step back. In a software system, we have system behaviors. System behaviors are broken down into small chunks, often called functions (later, we’ll call these frames). Each of these functions encapsulates some work to be performed. While functions encapsulate behaviors, in principle, we have the option for any function to call another. Additionally, in most languages, functions can even call themselves.
When it comes to software defects, a bug may appear in a given function, but may have originated someplace else entirely. For instance, the example of a simple mathematical division function that takes two numbers as arguments and divides them. Simple, right? Now, what if the function is called by another function, but the function is asked to divide by zero? It is quite likely the function may result in an error, halt execution, and a stack trace will appear on the console (more on this in just a moment).
We can see from this scenario is that not only are function behaviors important, but so too is how our functions are positioned relative to one another. In flamegraph terminology, we call this ancestry—a function that calls another is its ancestor. Ancestors are important because their behaviors and actions can affect the functions they invoke. Remember this when we discuss flamegraphs.
While our division example is simple, modern applications often have many layers of functions calling others. To make matters more complicated, we often have many layers of software that contribute to the call stack. Code from our runtime or imported libraries can pollute our call stack and make it hard to read or decipher when fixing defects.
By now you’re probably wondering: “What does all this talk of call stacks have to do with our original topic of stack traces and performance?”
Well, I’m glad you asked! Now that you understanding what a call stack is, we can get to our next topic, the stack trace.
A stack trace is a snapshot of our call stack at a point in time. A stack trace is like a breadcrumb trail left behind by errors in our code and performance issues. As I said before, not only is the function itself important, but the other calling functions are important for understanding what could happen in the run-up to an important event in our application.
You’ve likely seen a call stack, but just in case you haven’t, you can check out the first image on this page to see one in the flesh.
In the linked example, you can see an error, with a stack of functions that led to the original error’s occurrence. The stack of functions helps trace the origin of the function call to decipher what went wrong. As one function calls the next, it is added to the top of the stack. We can then see the most recent function as the topmost function, and each ancestor function in order.
That concludes our section on stack traces. With our foundational understanding of stack traces and call stacks, we can move on and look at the last part of this discussion—flamegraphs.
So far, we’ve talked mostly about code errors, not performance. When a bug appears, we want to isolate the conditions surrounding its appearance and replay the steps to recreate the bug. With performance, we need a way to do the same. We need to take a snapshot of the current state of the system and its performance, then reassess our situation, make changes, and retake snapshots of the current state of the system for review.
Performance tuning starts by finding, measuring, and optimizing to alleviate the biggest bottleneck first. As creators of performance-tuning software (Retrace) we know this process of measure, update, measure well. So, we’ll need some tools to gather the measurements we need. It’s at this point that our previously discussed call stacks can aid us with our performance investigation. To get our data set, we’ll use a process called profiling. When we profile, we take periodic snapshots of the current state of our call stack. When we have our snapshotted data, we’re able to see which functions appear repeatedly, and therefore might be a candidate for performance improvements. To find out for sure, we’ll need to understand our process for taking these system metrics.
But there’s a problem.
A modern application comprises many computations, and therefore, many call stacks. So how are we reasonably going to sift through and make sense of the mountains of data?
The answer is a flamegraph.
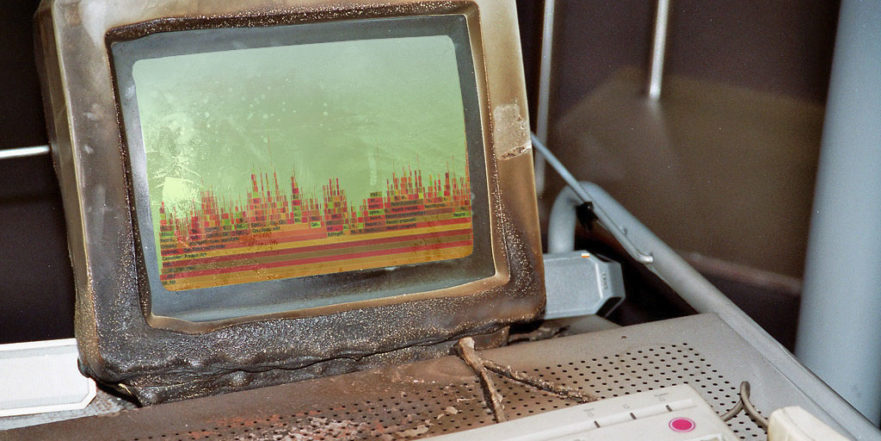
A flamegraph is a way of visualizing your call stack. As with all visualizations, it’s designed to turn raw data into a visual pattern that’s easier to digest. As you can see from the images on this site, a flamegraph gets its name not only because it shows what is hot, or resource intensive, but also because the chart typically looks like flames. The flame colors are optional, naturally.
Along the x-axis are groupings of functions, or frames. We group the x-axis across the sampling period. Grouping our sampling means that the chart doesn’t necessarily depict a time-series plot of data. Rather, it shows an aggregation of time functions spent on the CPU. The wider the bar on the x-axis, the longer the frame has spent on the CPU. The y-axis shows the depth of our call stack, and we can see the origin of each function call.
Now that we’ve got our flamegraph, we’ve got the basis for our call-stack-based performance improvements. There are many ways to performance-tune an application based on flamegraphs. Note that it does matter what language is being used. Different languages and language features require different optimization techniques. Because of this, it’s somewhat hard to give blanket advice on how to use a flamegraph for performance improvements.
Although it will always depend on your use case, I won’t let you leave without giving you a leg up with different patterns to spot in a flamegraph when debugging.
Any wide and tall sections of the flamegraph are worthy of investigation. Due to the nature of flamegraphs, a wide horizontal bar will tell us that we’re running that function on the CPU for a long time.
Now that you’ve seen how call stacks and stack traces work, I hope the flamegraph chart itself seems more straightforward than before.
Before I depart, let me say that the best way to wrap your head around the way flamegraphs work is to create a small application of example functions. Create functions that perform lots of computation and intertwine all the functions together. Once you’ve got your demo application, you can easily analyze it with flamegraph tooling.
As always, don’t expect to understand completely how flamegraphs work from reading alone. Try them out, experiment, and before you know it, your teammates will be asking for your skills to help them tune their applications, too!
Stackify's APM tools are used by thousands of .NET, Java, PHP, Node.js, Python, & Ruby developers all over the world.
Explore Retrace's product features to learn more.


