
One of our .NET background services running as an Azure Worker Role uses a lot of CPU and runs on a bunch of servers. I decided to spend some time today to see if I could troubleshoot high CPU usage in production. I documented how I went about solving the problem with ANTS and Process Hacker so hopefully, it could help others!
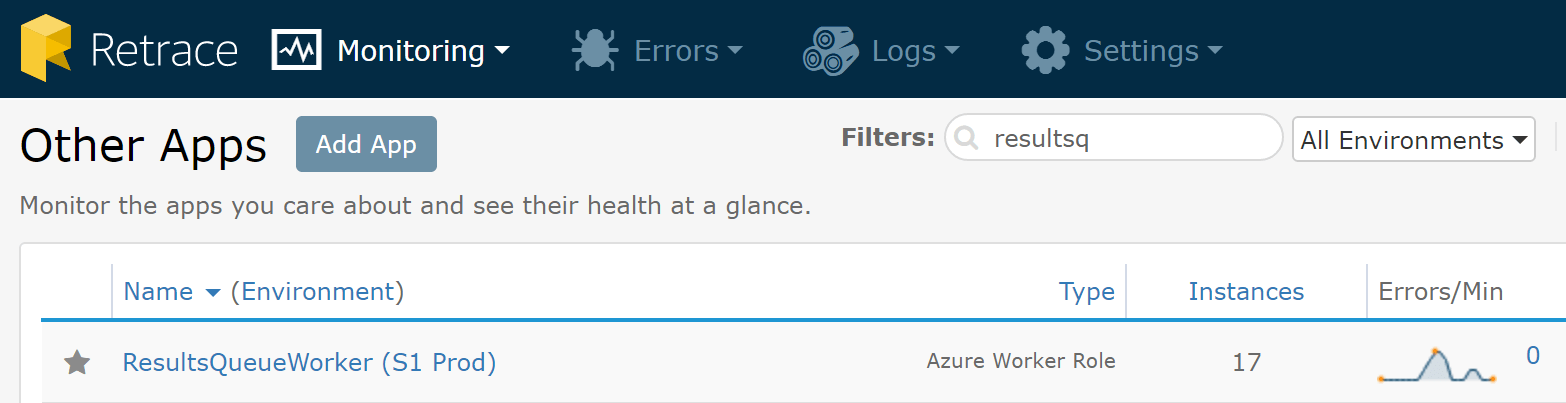
Retrace shows me that we have 17 servers running the same application. Obviously, there has to be some room for improvement in the CPU usage so we can cut down the number of servers and save some money on Azure.
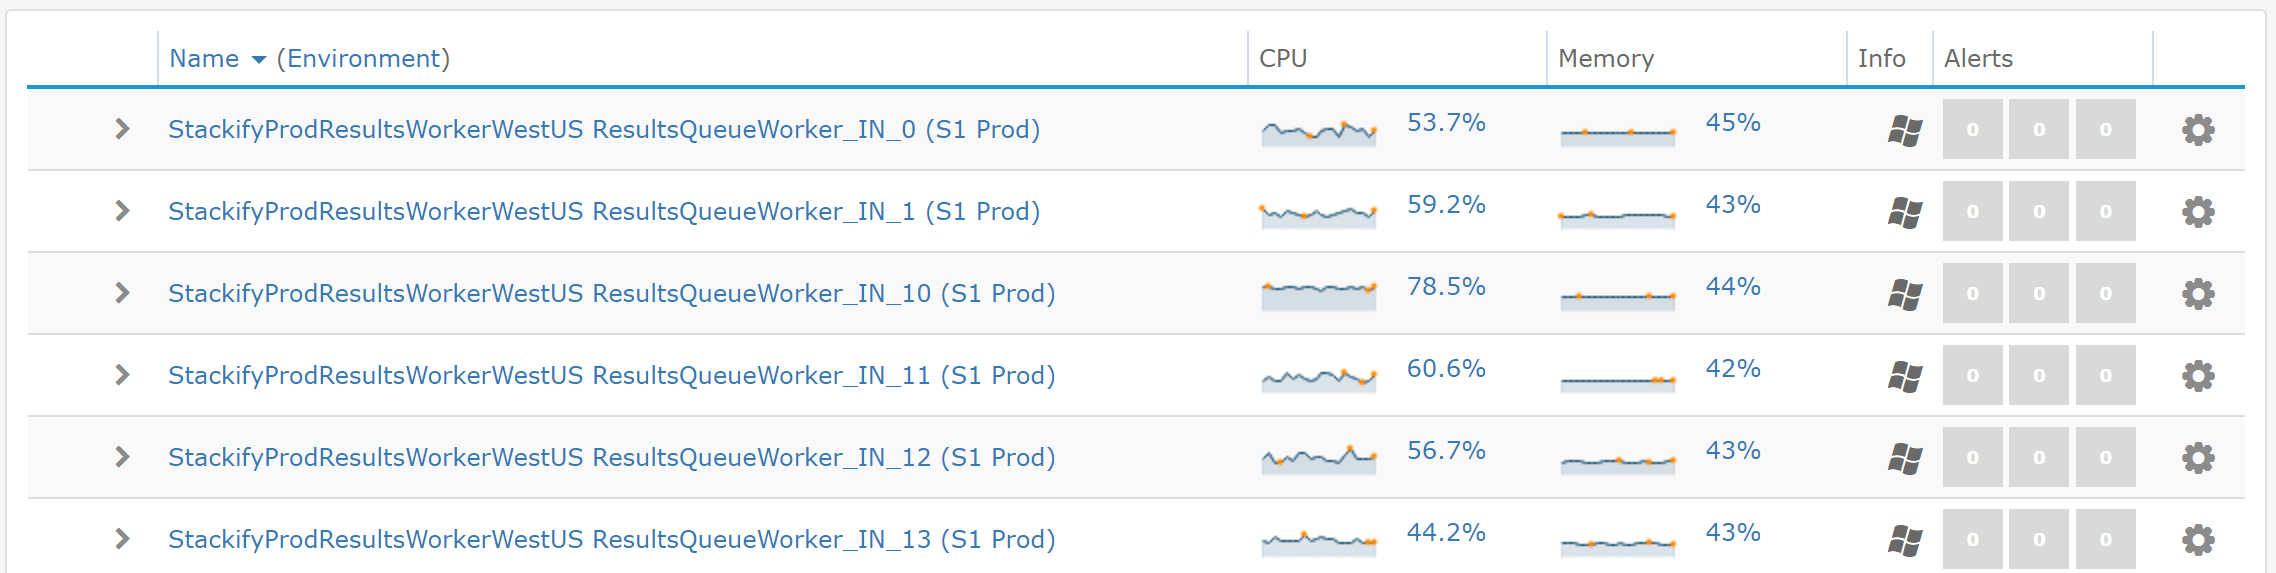
Retrace shows me all of the servers individually and I can see the CPU usage across all of them runs pretty hot.
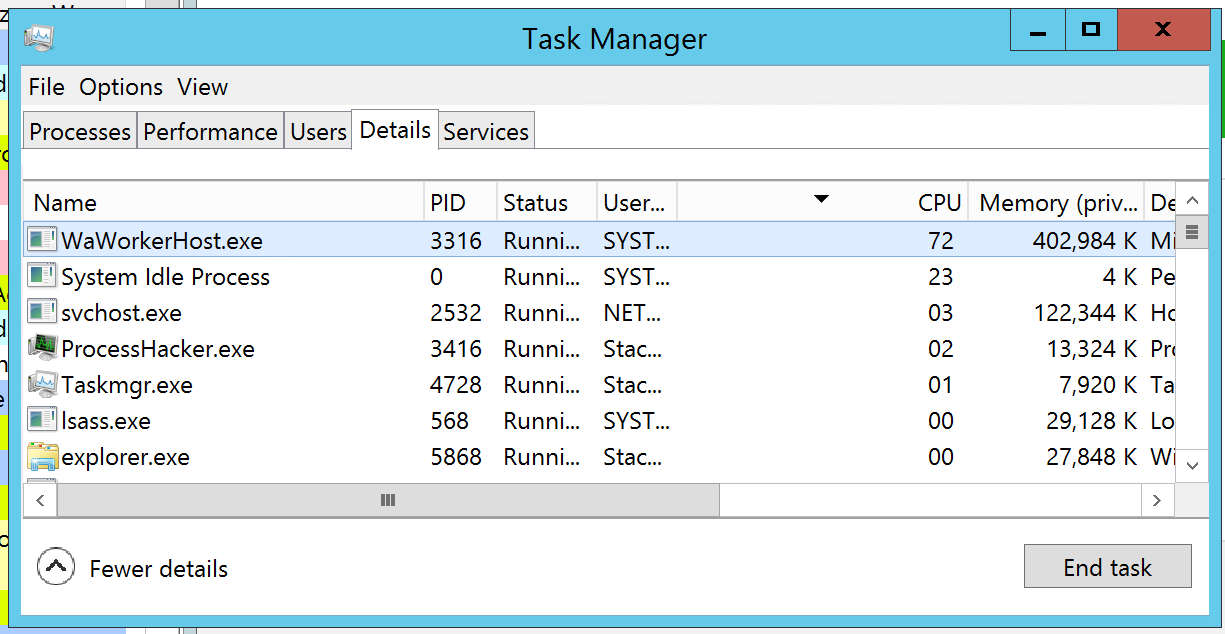
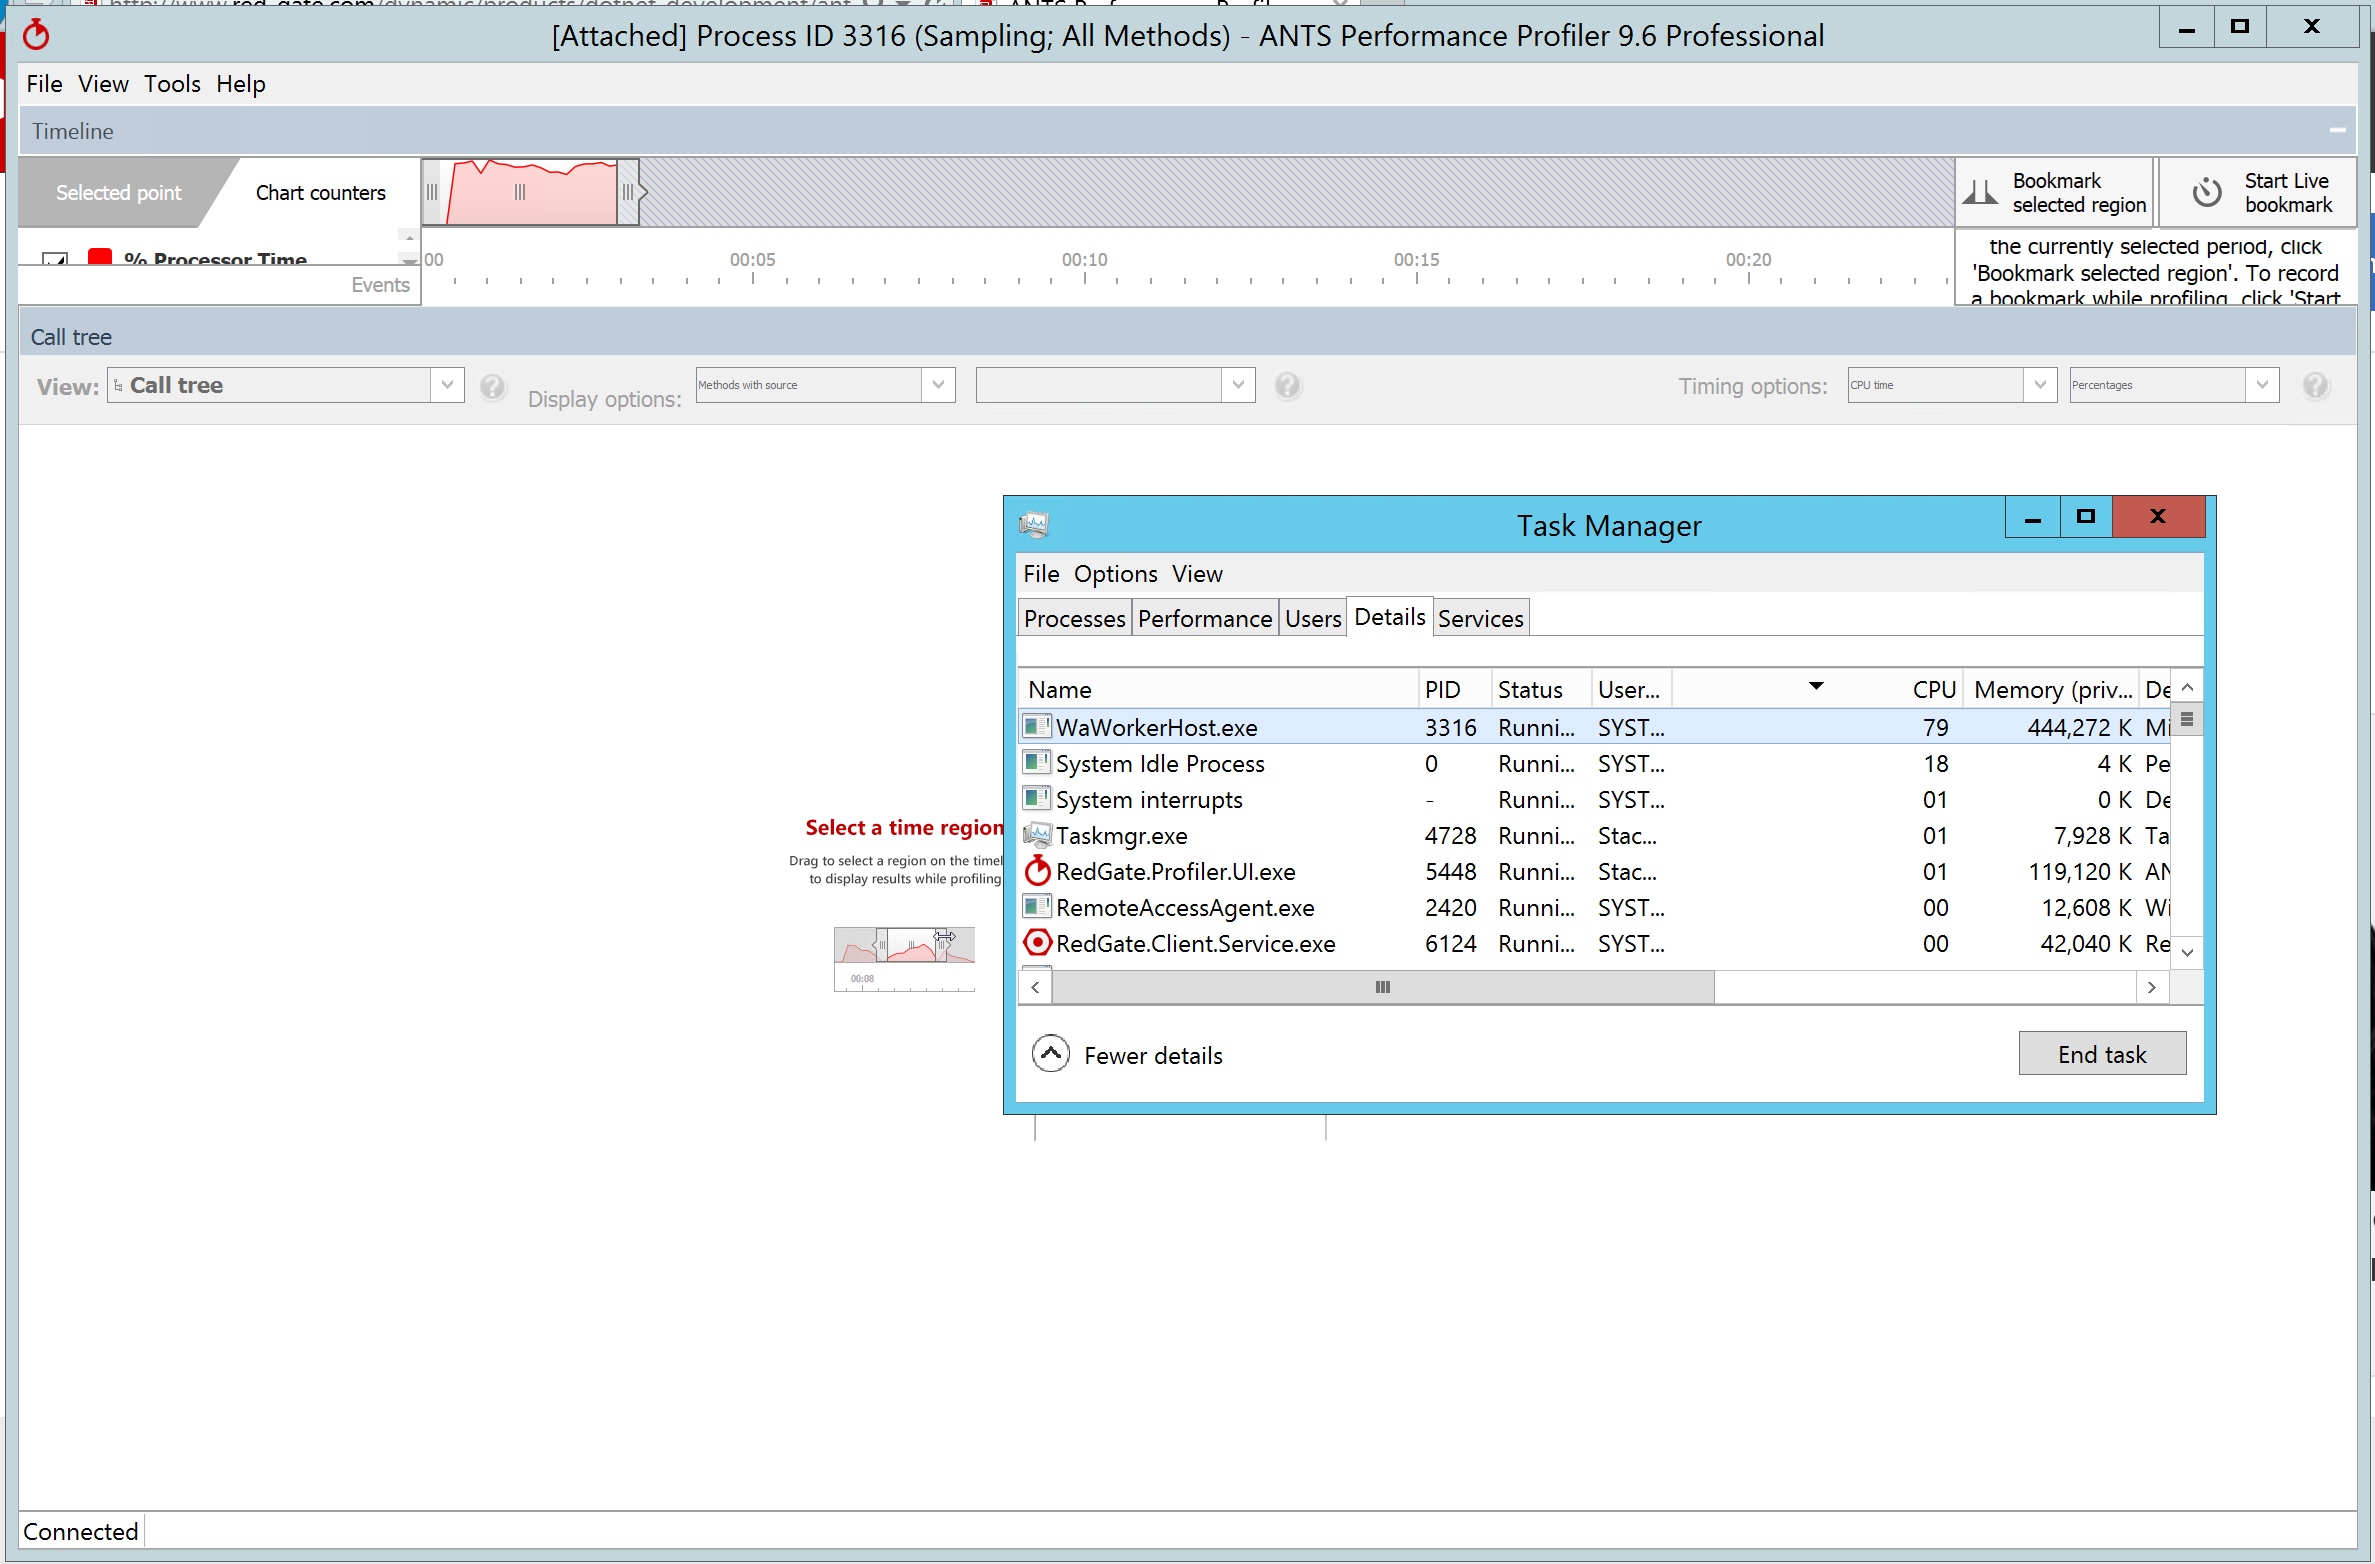
When I use remote desktop to log into one the servers, I can verify that task manager shows WaWorkerHost as having high CPU. Azure Worker Roles are sort of like Windows Services but are a little different. Azure has a special way of starting them up and they all run as WaWorkerHost.
The first thing I am going to do is try using Process Hacker to see what it shows me. It is basically a nice upgrade from task manager with some unique features that I will show you.
I start with Process Hacker because it is the least invasive to my application. I am trying to do this on a production server and I don’t want to mess up my application. Process Hacker is not a profiler but can show me some awesome details. If this doesn’t help, profiling is the next step.
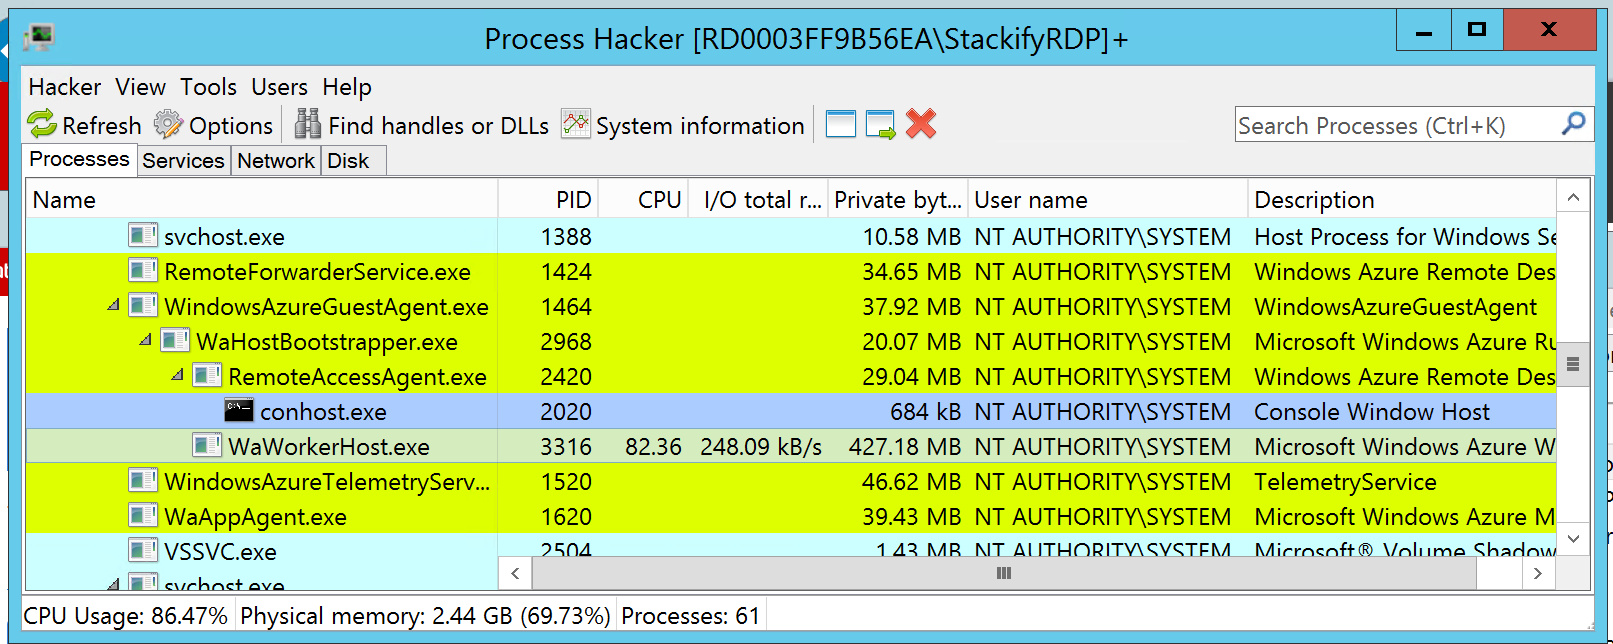
To start, I find my process running in Process Hacker:
If you double click on your process, it can show you a bunch of cool things like .NET performance counters, the loaded assemblies, and much more.
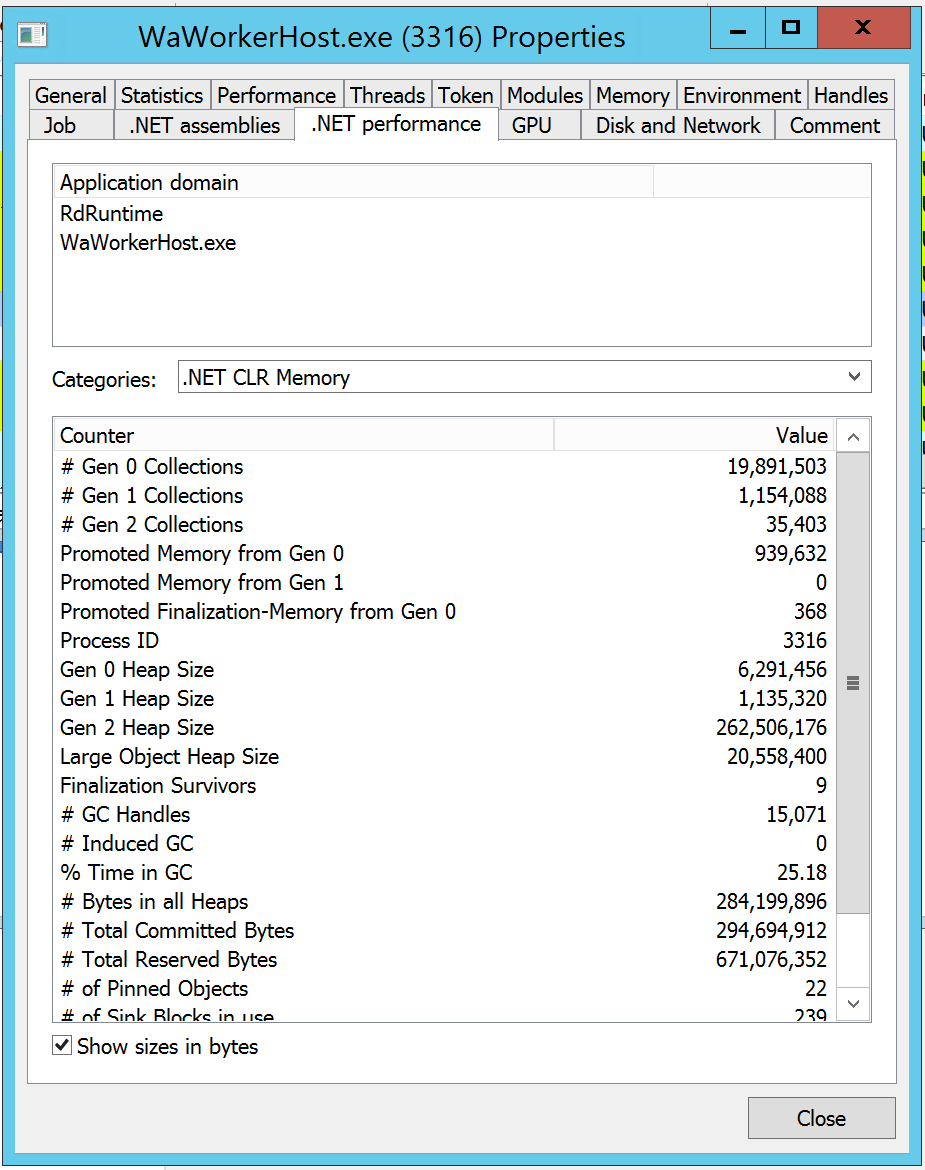
Since I am most interested in high CPU, I am going to check out the threads view. It shows me all the threads running within my process and shows how much CPU each thread is using.
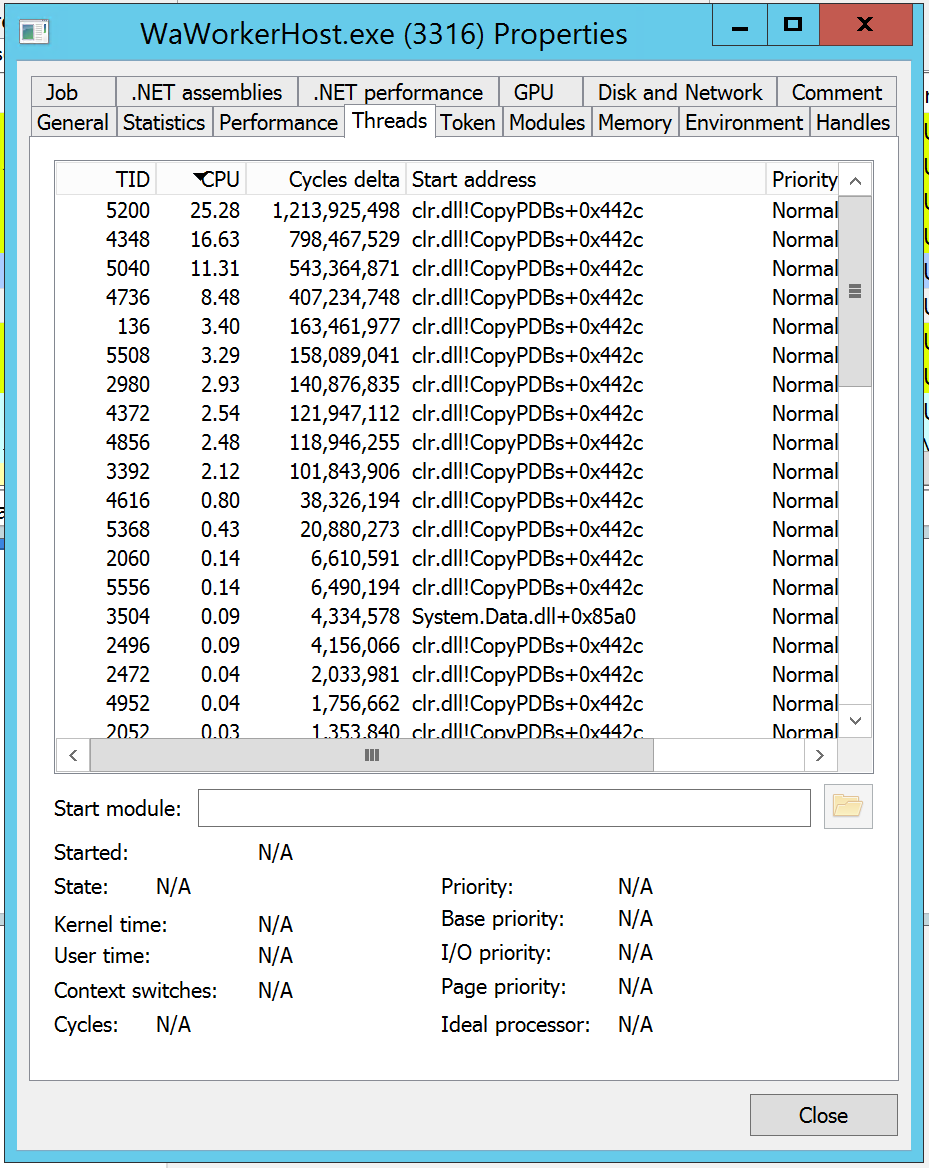
If you double click on one of the threads you can see the full stack trace for the thread. This is what I am after, to see if there is a pattern to what is using the most CPU.
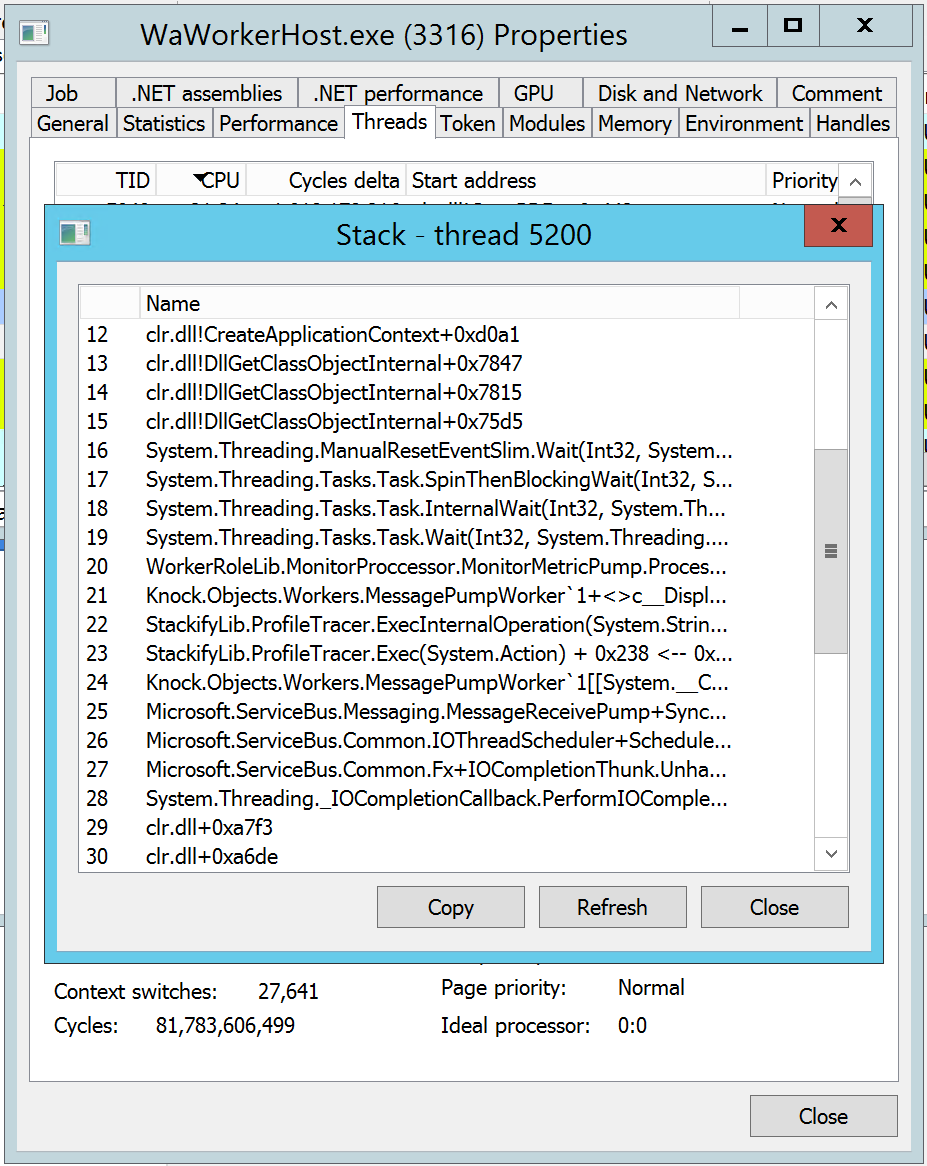
Depending on what your application does, you may or may not find much that is useful. This particular app does a lot of very short-lived things, and this time around I didn’t find much of interest. Other times, it has shown me exactly what I needed to know.
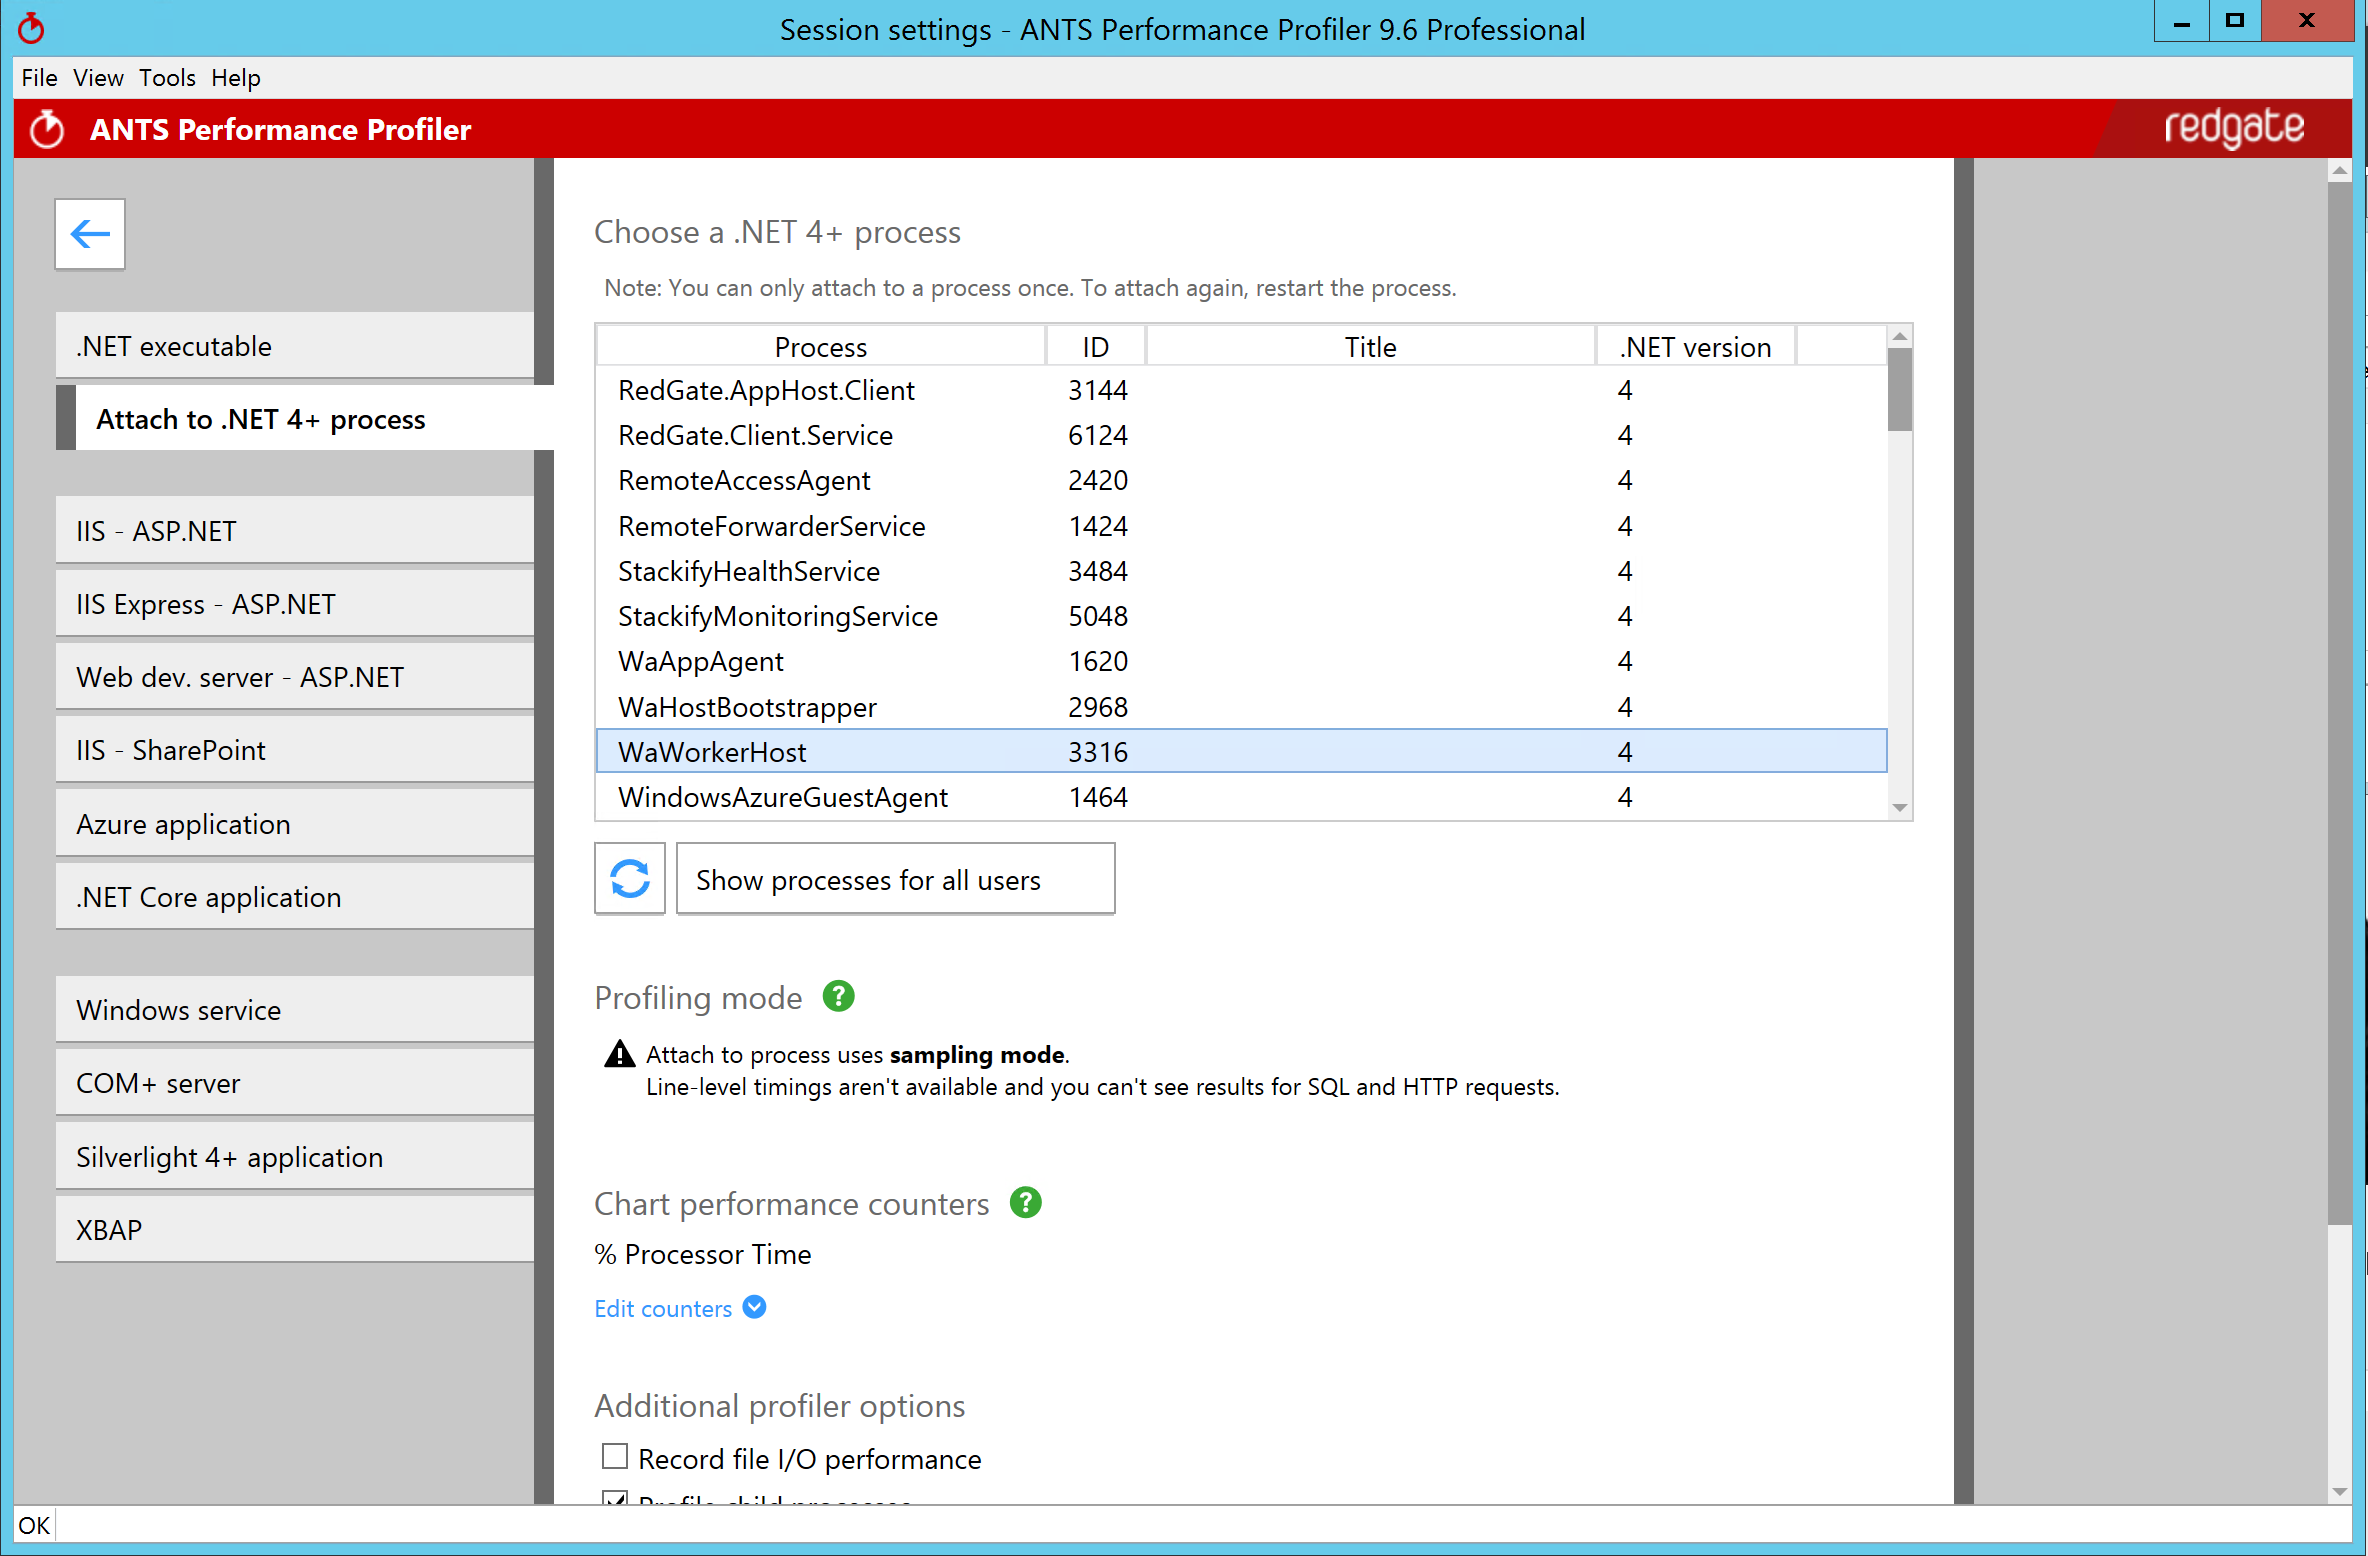
So Process Hacker didn’t help me this time around, so I am going to fire up ANTS Performance Profiler. I have used a bunch of different .NET profilers, and it is still my favorite. Since ANTS comes with a free trial, I can install it on my server and start a free trial. 🙂
ANTS will let me attach to a running process, which is what I want to do in this case. It is only going to do lightweight sampling, but hopefully, that will be enough to help me find my problem.
If that doesn’t work, I would have to figure out how to stop my app and restart it with the profiler attached. Since this is an Azure Worker Role, I’m not even sure how to do that. It isn’t the same as a Windows Service.
Because ANTS is running in sampling mode, it isn’t killing the CPU on my server. The CPU of my app was already running 70-80% and is still looking about the same.
I let ANTS run for a few minutes and now I can see some meaningful data about what parts of my code are slow.
The call tree view can show me the hot path in my code and you can expand the tree elements to walk through how long each method takes.

I prefer using the methods grid mode which allows me to just sort the methods by the most expensive.
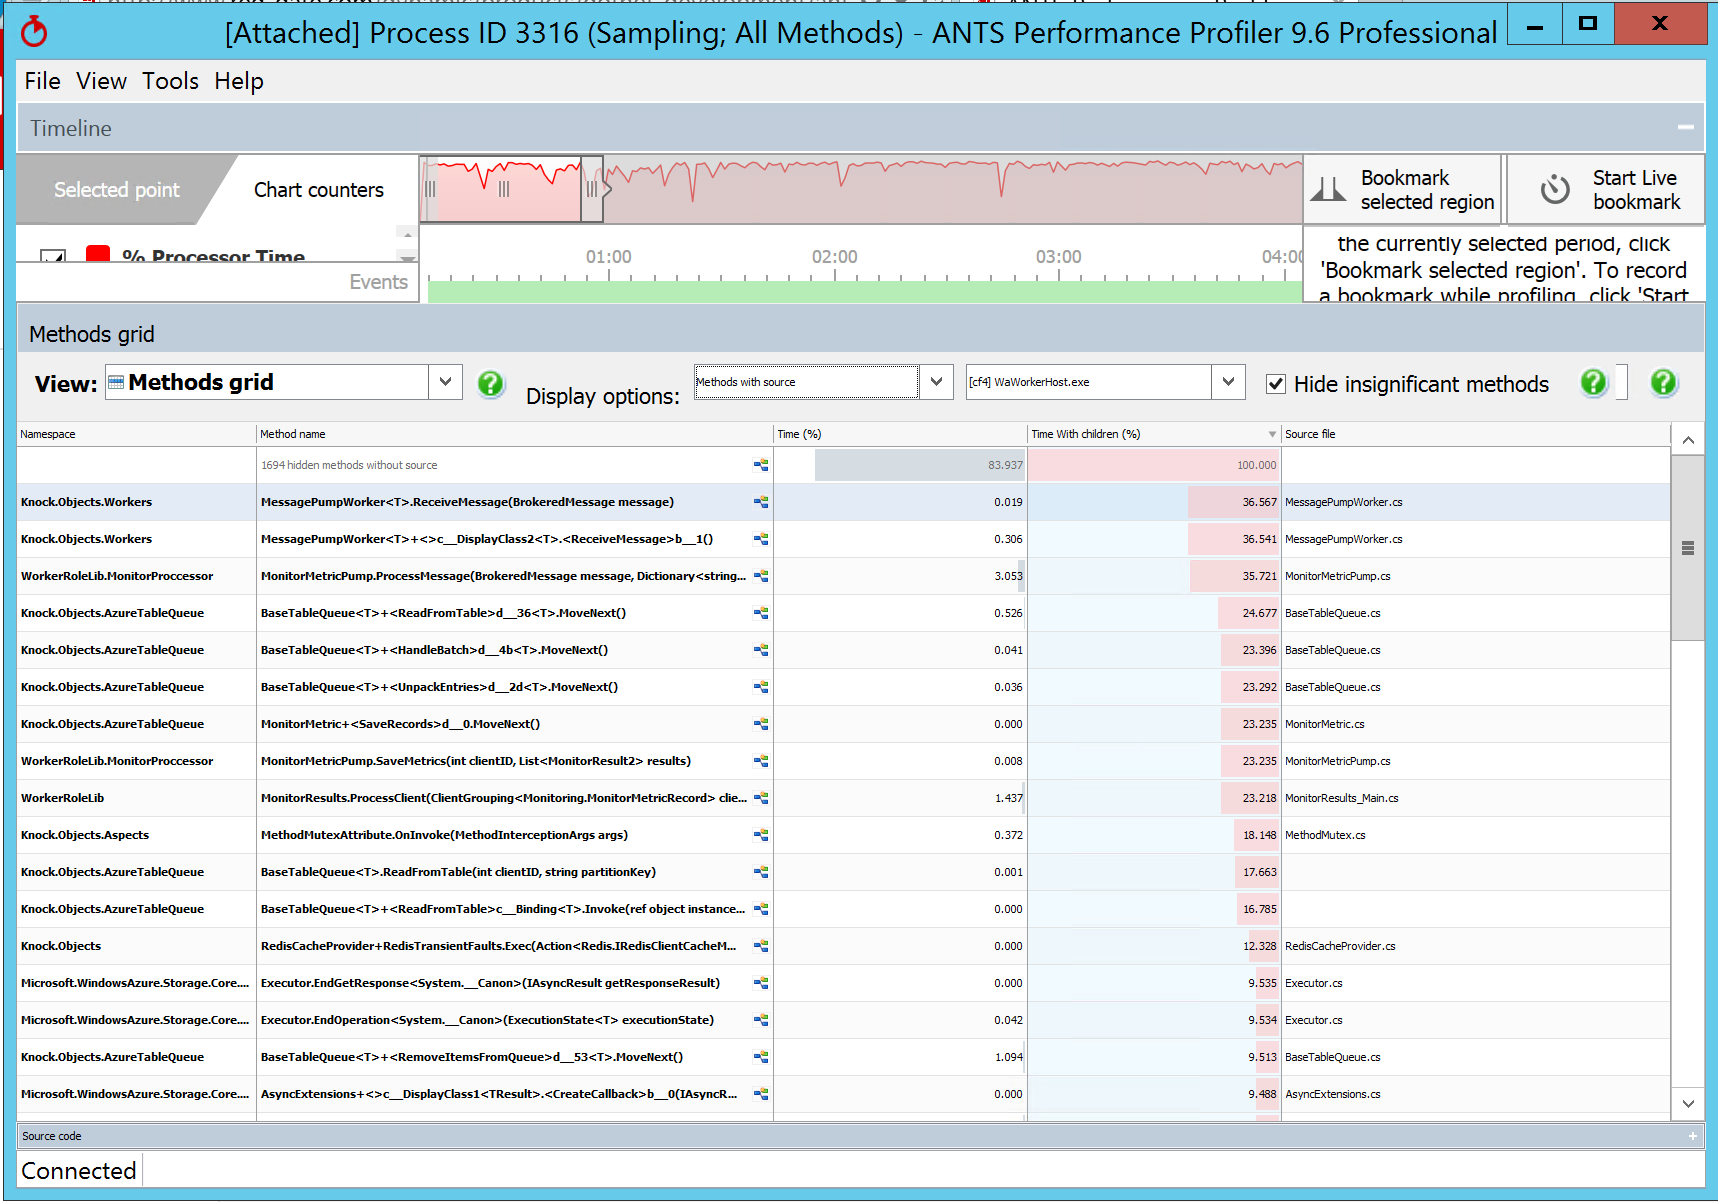
One thing I noticed was a method around Redis transient faults taking 12% of the time. With ANTS, I can expand that method to see all of its children and dig deeper.
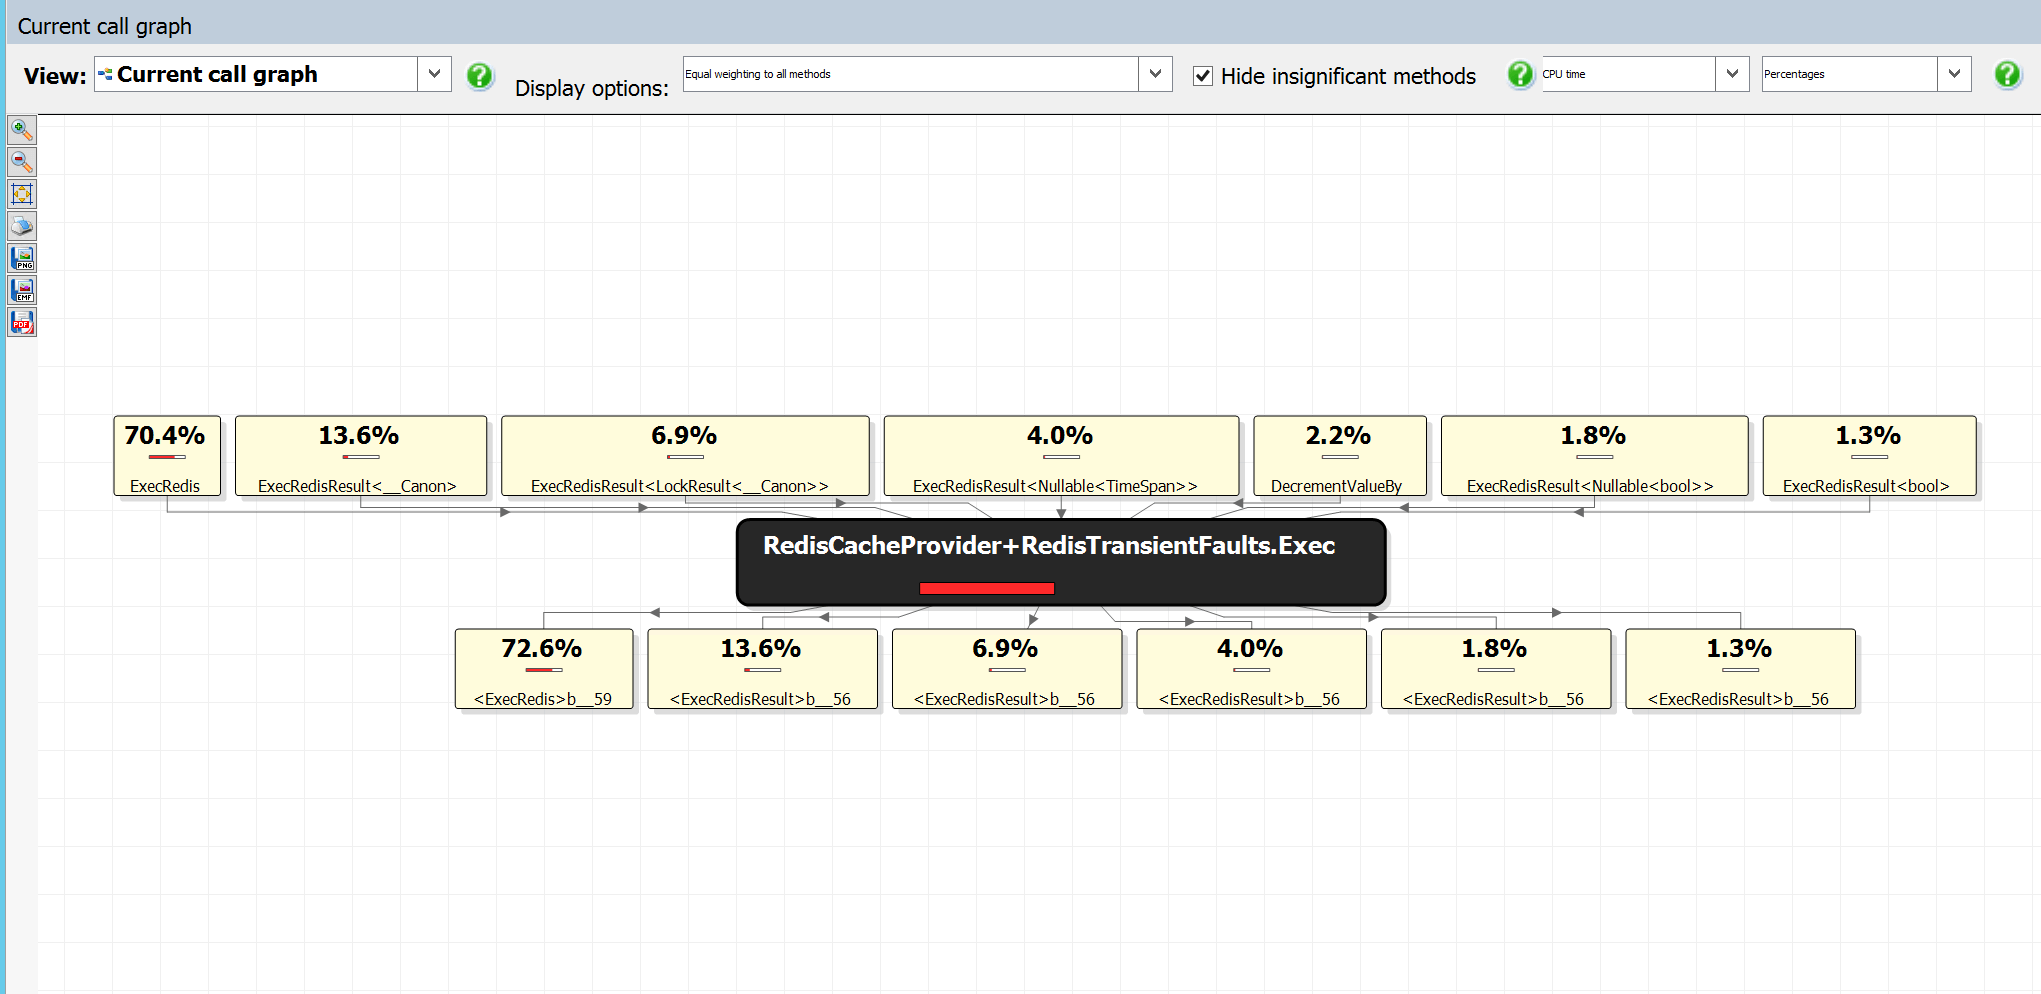
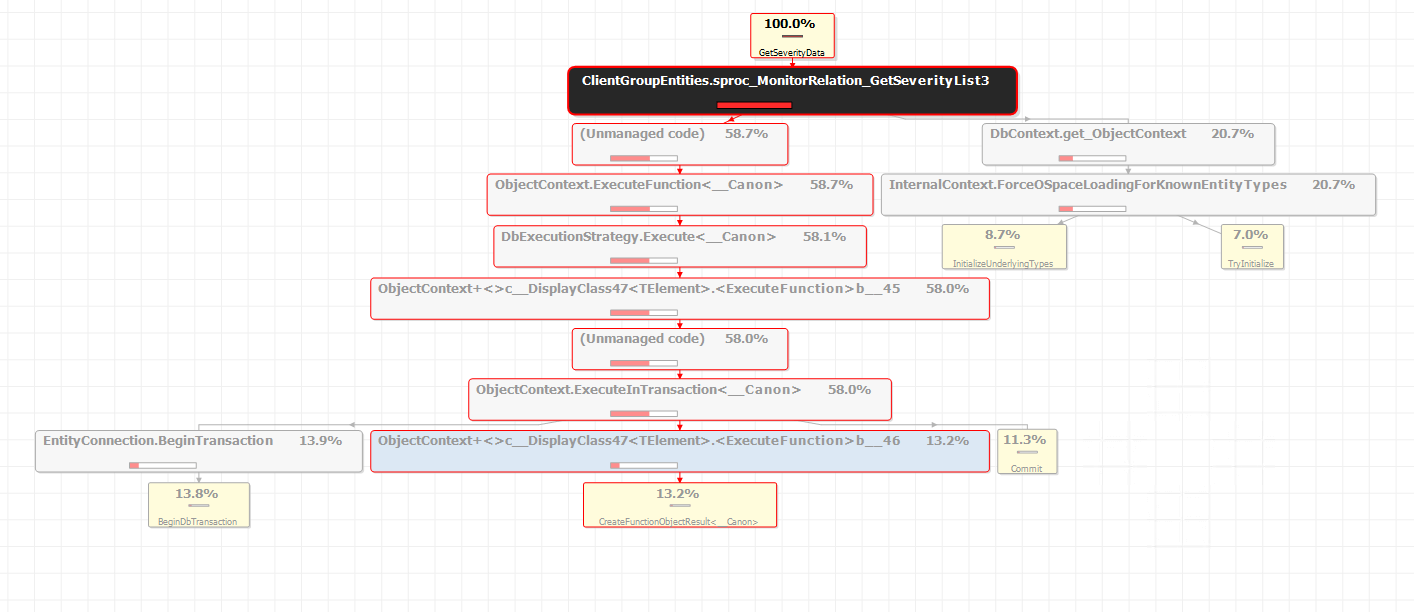
As I dig around in ANTS looking at expensive methods, I’m also looking at my code in Visual Studio trying to evaluate what the code is doing and any improvements I can make.
One of the things I found was Entity Framework… being Entity Framework. When it comes to performance, avoid it all costs. Use a low-level SqlDataReader, Dapper, or simply anything else.
Entity Framework and most ORMs for that matter add a lot of overhead. They are great for low volume CRUD type code but should be avoided in high volume places where performance matters. When you have 17 servers running the same app, performance matters.
I found a few more little code changes and found some potential improvements by switching some code to async. A few little tweaks here and there eventually add up to some good improvements!
Hopefully, this step-by-step walkthrough of my journey can give you some ideas of how to safely profile your production applications to try and find high CPU problems.
ANTS has a ton of great functionality. Way more than I want to cover here. Be sure to check out their site if you want to learn more. It is definitely a product that I recommend!
Retrace’s APM capabilities are awesome for tracking the performance of your application across multiple servers. Retrace helps identify slow web requests, slow SQL queries, etc. However, when you need to get down and dirty with high CPU problems, a more traditional profiler and approach, as documented here, is your best bet.
Stackify's APM tools are used by thousands of .NET, Java, PHP, Node.js, Python, & Ruby developers all over the world.
Explore Retrace's product features to learn more.


