
Being able to execute SQL performance tuning is a vital skill for software teams that rely on relational databases. Vital isn’t the only adjective that we can apply to it, though. Rare also comes to mind, unfortunately.
Many software professionals think that they can just leave all the RDBMS settings as they came by default. They’re wrong. Often, the default settings your RDBMS comes configured with are far from being the optimal ones. Not optimizing such settings results in performance issues that you could easily avoid.
Some programmers, on the other hand, believe that even though SQL performance tuning is important, only DBAs should do it. They’re wrong as well.
First of all, not all companies will even have a person with the official title “DBA.” It depends on the size of the company, more than anything.
But even if you have a dedicated DBA on the team, that doesn’t mean you should overwhelm them with tasks that could’ve been performed by the developers themselves. If a developer can diagnose and fix a slow query, then there’s no reason why they shouldn’t do it. The relevant word here, though, is can—most of the time, they can’t.
How do we fix this problem? Simple: We equip developers with the knowledge they need to find slow SQL queries and do performance tuning in SQL Server. In this post, we’ll give you seven tips to do just that.
Before we show you our list of tips you can use to do SQL performance tuning on your software organization, I figured we should define SQL performance tuning.
So what is SQL performance tuning? I bet you already have an idea, even if it’s a vague one.
In a nutshell, SQL performance tuning consists of making queries of a relation database run as fast as possible.
As you’ll see in this post, SQL performance tuning is not a single tool or technique. Rather, it’s a set of practices that makes use of a wide array of techniques, tools, and processes.
Without further ado, here are seven ways to find slow SQL queries in SQL Server.
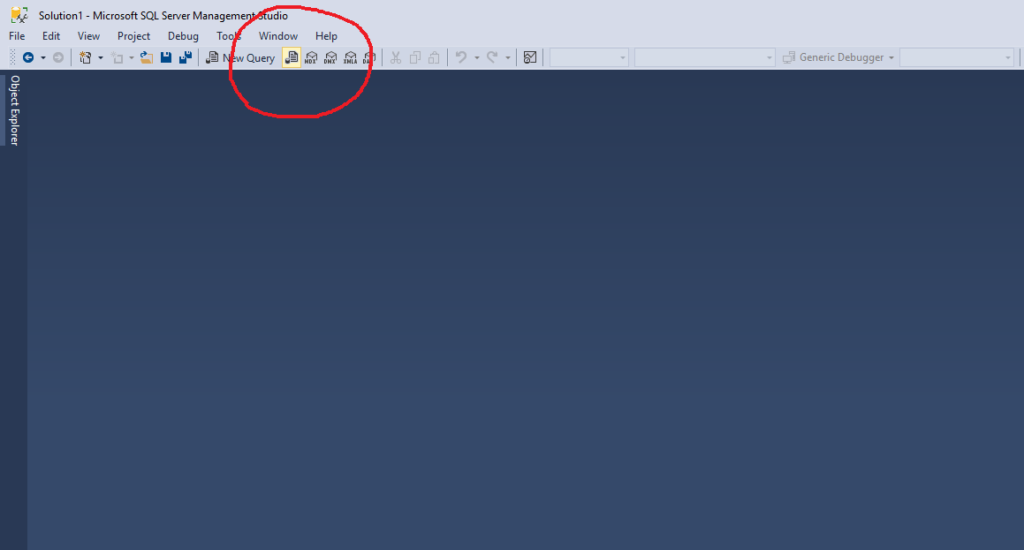
In order to diagnose slow queries, it’s crucial to be able to generate graphical execution plans, which you can do by using SQL Server Management Studio. Actual execution plans are generated after the queries run. But how do you go about generating an execution plan?
Begin by clicking on “Database Engine Query”, on the SQL Server Management Studio toolbar.
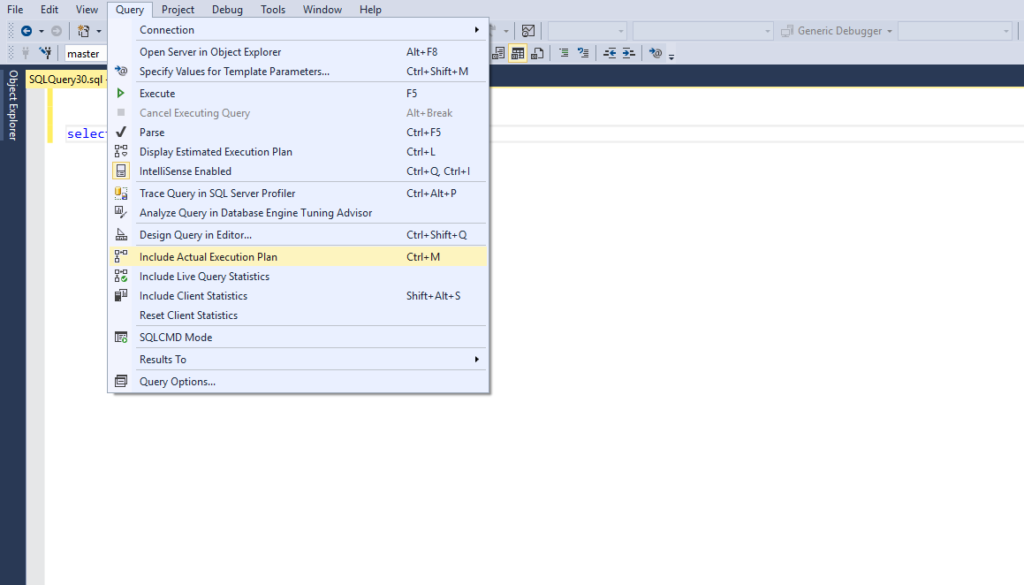
After that, enter the query and click “Include Actual Execution Plan” on the Query menu.
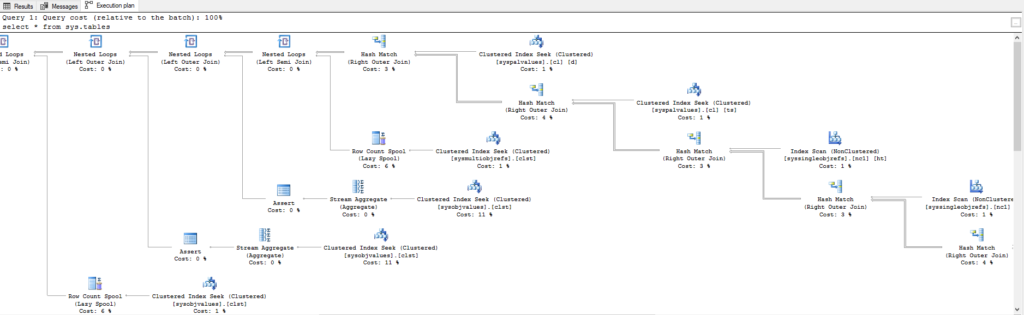
Finally, it’s time to run your query. You do that by clicking on the “Execute” toolbar button or pressing F5. Then, SQL Server Management Studio will display the execution plan in the results pane, under the “Execution Plan” tab.
Resource usage is an essential factor when it comes to SQL database performance. Since you can’t improve what you don’t measure, you definitely should monitor resource usage.
So how can you do it?
If you’re using Windows, use the System Monitor tool to measure the performance of SQL Server. It enables you to view SQL Server objects, performance counters, and the behavior of other objects.
Using System Monitor allows you to monitor Windows and SQL Server counters simultaneously, so you can verify if there’s any correlation between the performance of the two.
Another important technique for SQL performance tuning is to analyze the performance of Transact-SQL statements that are run against the database you intend to tune.
You can use the Database Engine Tuning Advisor to analyze the performance implications.
But the tool goes beyond that: it also recommends actions you should take based on its analysis. For instance, it might advise you to create or remove indexes.
One of the great features of SQL Server is all of the dynamic management views (DMVs) that are built into it. There are dozens of them and they can provide a wealth of information about a wide range of topics.
There are several DMVs that provide data about query stats, execution plans, recent queries and much more. You can use them together to get some amazing insights.
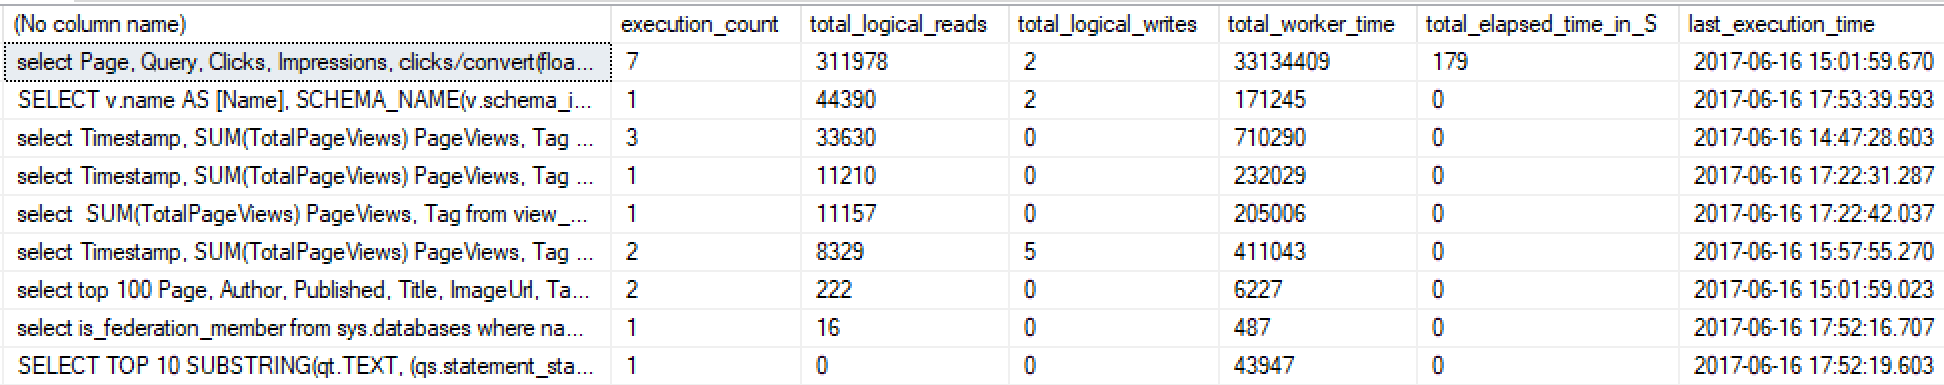
For example, the query below can be used to find the queries that use the most reads, writes, worker time (CPU), etc.
SELECT TOP 10 SUBSTRING(qt.TEXT, (qs.statement_start_offset/2)+1,
((CASE qs.statement_end_offset
WHEN -1 THEN DATALENGTH(qt.TEXT)
ELSE qs.statement_end_offset
END - qs.statement_start_offset)/2)+1),
qs.execution_count,
qs.total_logical_reads, qs.last_logical_reads,
qs.total_logical_writes, qs.last_logical_writes,
qs.total_worker_time,
qs.last_worker_time,
qs.total_elapsed_time/1000000 total_elapsed_time_in_S,
qs.last_elapsed_time/1000000 last_elapsed_time_in_S,
qs.last_execution_time,
qp.query_plan
FROM sys.dm_exec_query_stats qs
CROSS APPLY sys.dm_exec_sql_text(qs.sql_handle) qt
CROSS APPLY sys.dm_exec_query_plan(qs.plan_handle) qp
ORDER BY qs.total_logical_reads DESC -- logical reads
-- ORDER BY qs.total_logical_writes DESC -- logical writes
-- ORDER BY qs.total_worker_time DESC -- CPU time
The result of the query will look something like this below. The image below is from a marketing app I made. You can see that one particular query (the top one) takes up all the resources.
By looking at this, I can copy that SQL query and see if there is some way to improve it, add an index, etc.
Pros: Always available basic rollup statistics.
Cons: Doesn’t tell you what is calling the queries. Can’t visualize when the queries are being called over time.
One of the great features of application performance management (APM) tools is the ability to track SQL queries. For example, Retrace tracks SQL queries across multiple database providers, including SQL Server. Retrace tells you how many times a query was executed, how long it takes on average, and what transactions called it.
This is valuable information for SQL performance tuning. APM solutions collect this data by doing lightweight performance profiling against your application code at runtime.
Below is a screenshot from Retrace’s application dashboard showing which SQL queries take the longest for a particular application.
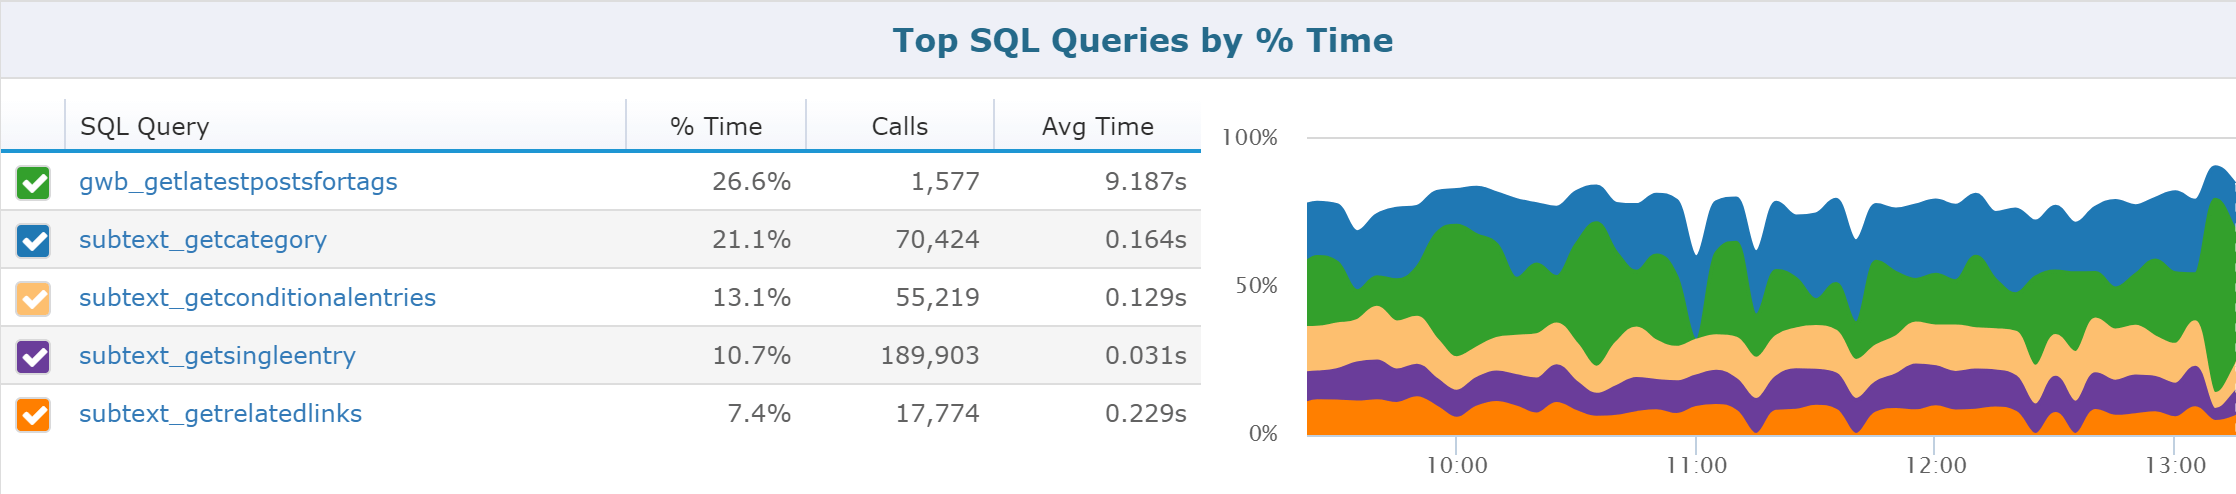
Retrace collects performance statistics about every SQL query being executed. You can search for specific queries to find potential problems.
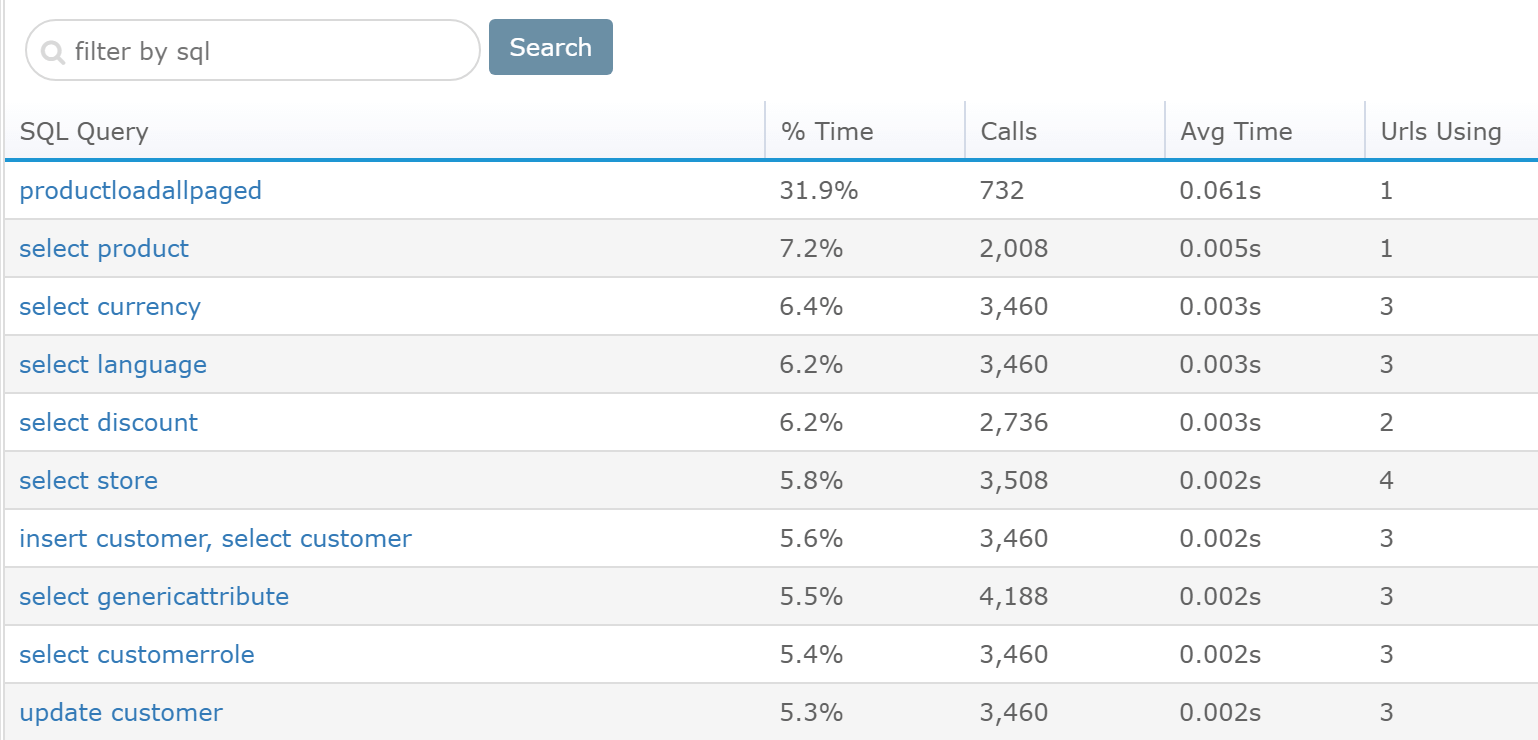
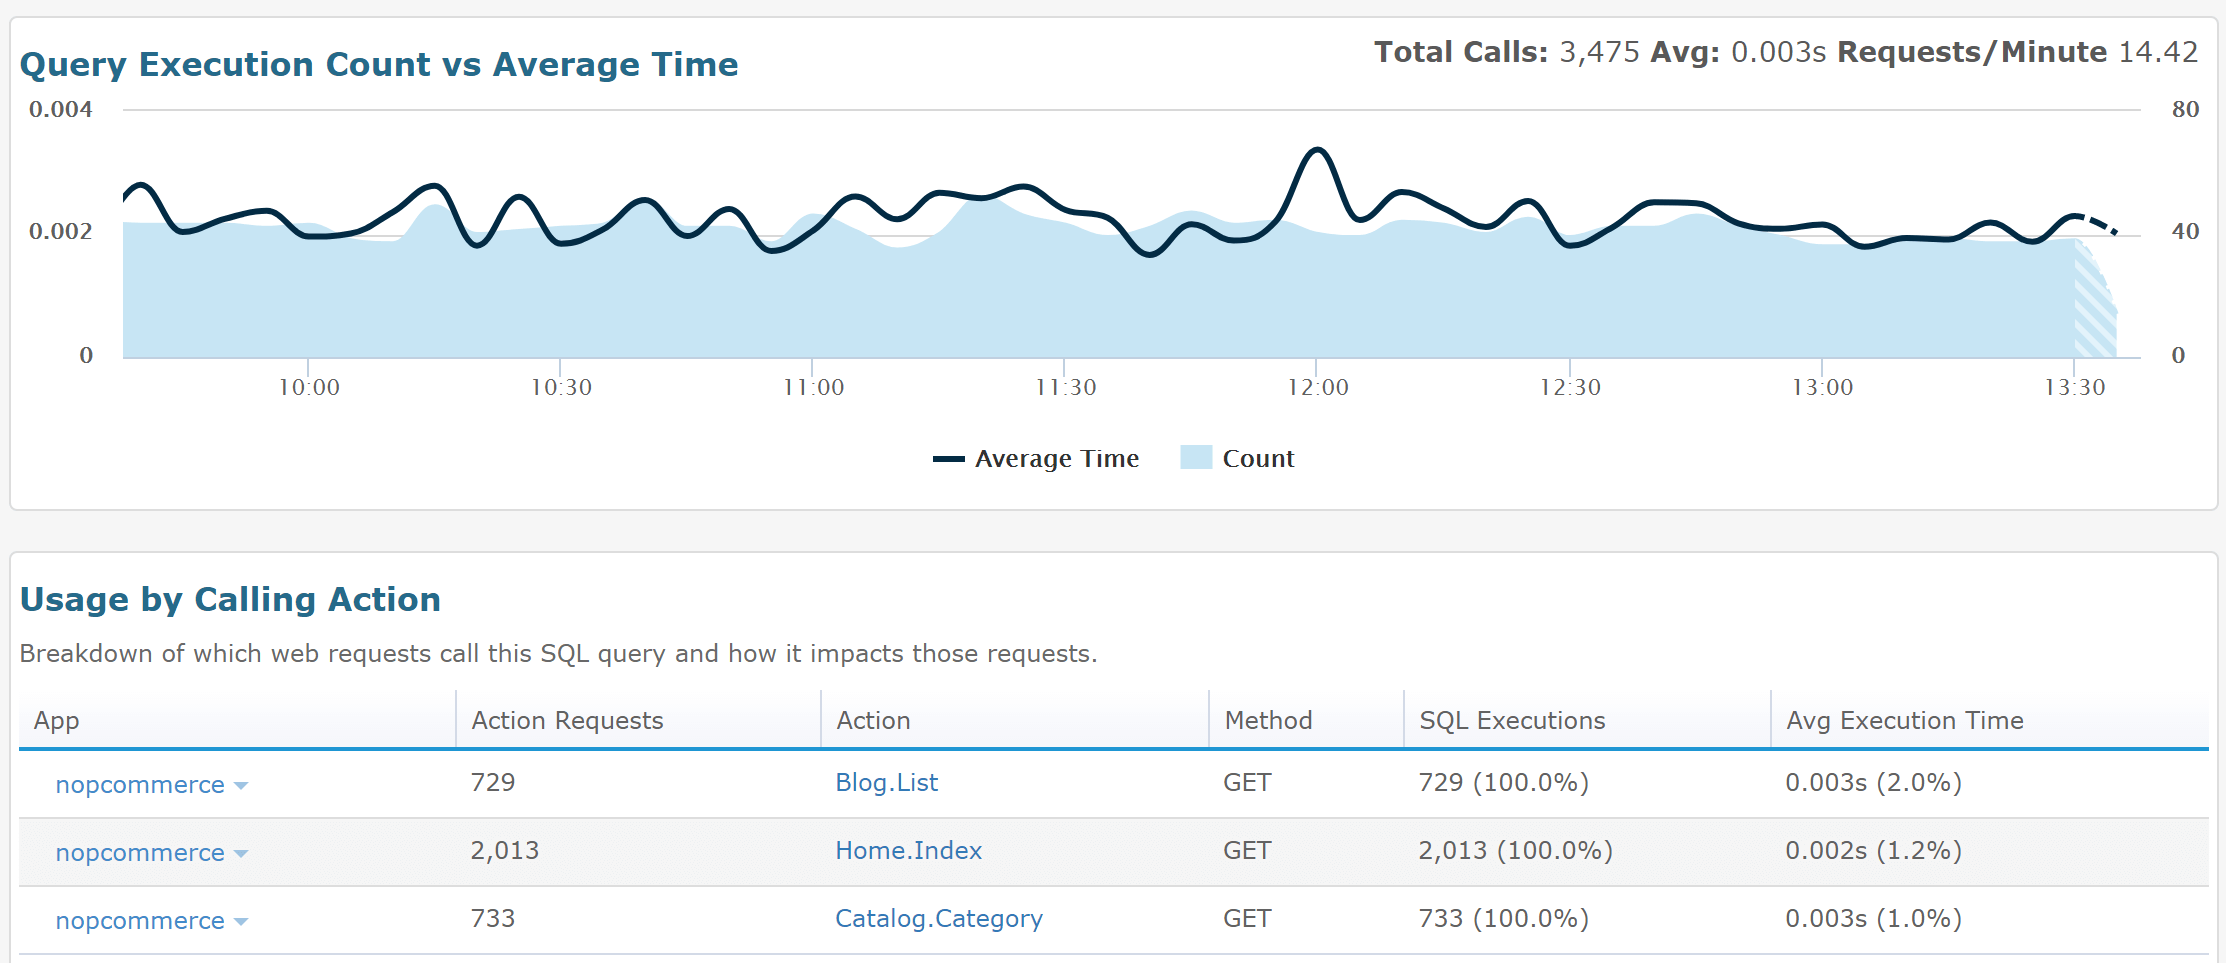
By selecting an individual query, you see how often that query is called over time and how long it takes. You also see what webpages use the SQL query and how it impacts their performance.
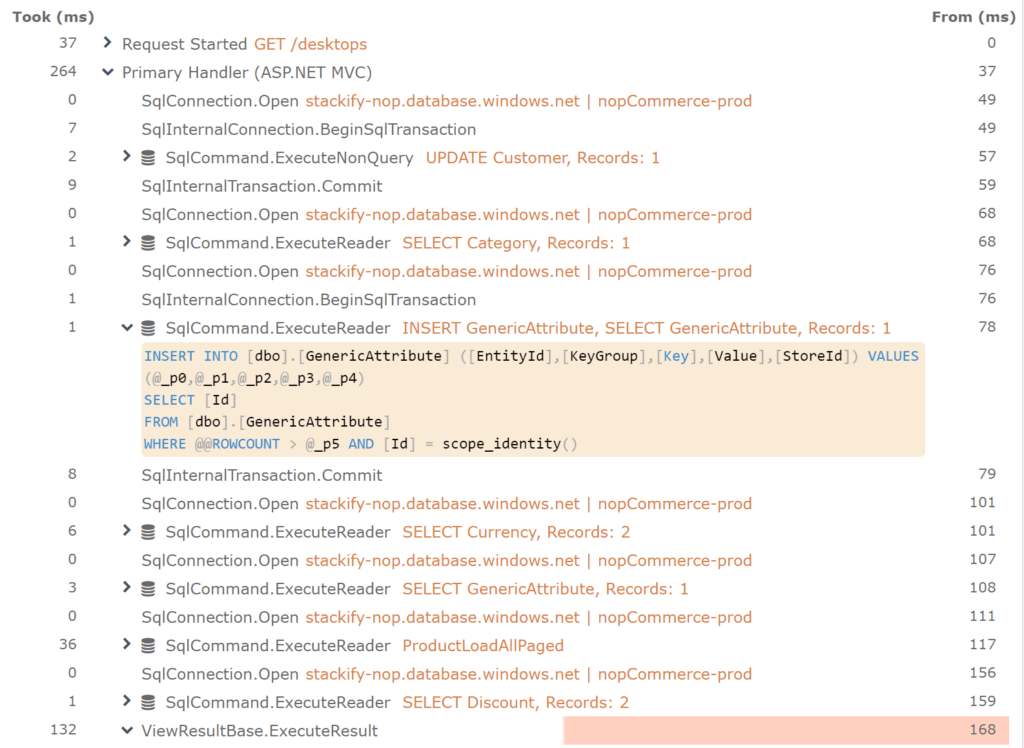
Since Retrace is a lightweight code profiler and captures ASP.NET request traces, it even shows you the full context of what your code is doing.
Below is a captured trace showing all the SQL queries and other details about what the code was doing. Retrace even shows log messages within this same view. Also, notice that it shows the server address and database name that’s executing the query. You can also see the number of records it returns.
As you can see, Retrace provides comprehensive SQL reporting capabilities as part of its APM capabilities. It also provides multiple monitoring and alerting features around SQL queries.
Pros: Detailed reporting across apps, per app, and per query. Shows transaction traces details how queries are used. Starts at just $10 a month. Is always running once installed.
Cons: Doesn’t provide the number of reads or writes per query.
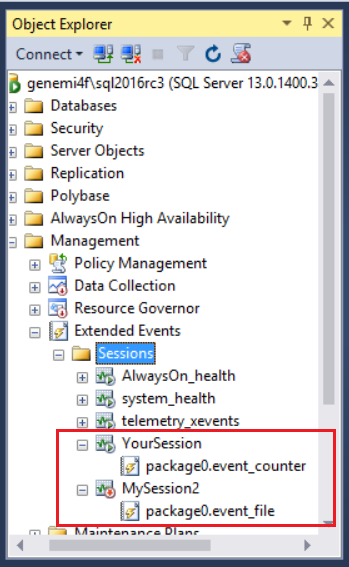
The SQL Server Profiler was around for a very long time. It was a very useful tool to see in real time what SQL queries are being executed against your database, but it’s currently deprecated. Microsoft replaced it with SQL Server Extended Events.
This is sure to anger a lot of people but I can understand why Microsoft is doing it. Extended Events works via Event Tracing (ETW).
This has been the common way for all Microsoft-related technologies to expose diagnostic data. ETW provides much more flexibility. As a developer, I could easily tap into ETW events from SQL Server to collect data for custom uses. That’s really cool and really powerful.
MORE: Introducing SQL Server Extended Events
Pros: Easier to enable and leave running. Easier to develop custom solutions with.
Cons: Since it is fairly new, most people may not be aware of it.
I’m going to assume that SQL Azure’s performance reporting is built on top of Extended Events. Within the Azure Portal, you can get access to a wide array of performance reporting and optimization tips that are very helpful.
Note: These reporting capabilities are only available for databases hosted on SQL Azure.
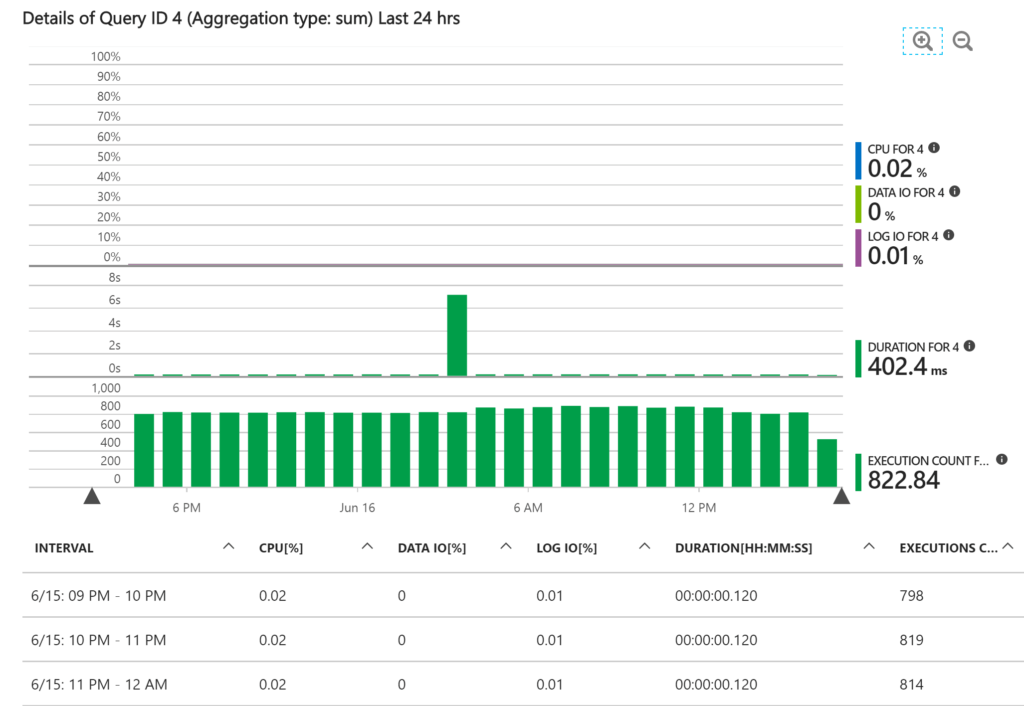
In the screenshot below, you can see how SQL Azure makes it easy to use your queries that use the most CPU, Data IO, and Log IO. It has some great basic reporting built into it.

You can also select an individual query and get more details to help with SQL performance tuning.
Pros: Great basic reporting.
Cons: Only works on Azure. No reporting across multiple databases.
Next time you need to do some performance tuning with SQL Server, you’ll have a few options at your disposal to consider. Odds are that you’ll use more than one of these tools depending on what you are trying to accomplish.
Try Stackify’s free code profiler, Prefix, to write better code on your workstation. Prefix works with .NET, Java, PHP, Node.js, Ruby, and Python.
If you’re using an APM solution like Retrace, be sure to check what kind of SQL performance functionality it has built-in. If you don’t have an APM solution or aren’t sure what it is, be sure to read this: What is Application Performance Management and 10 critical features that developers need in APM.
Stackify's APM tools are used by thousands of .NET, Java, PHP, Node.js, Python, & Ruby developers all over the world.
Explore Retrace's product features to learn more.


